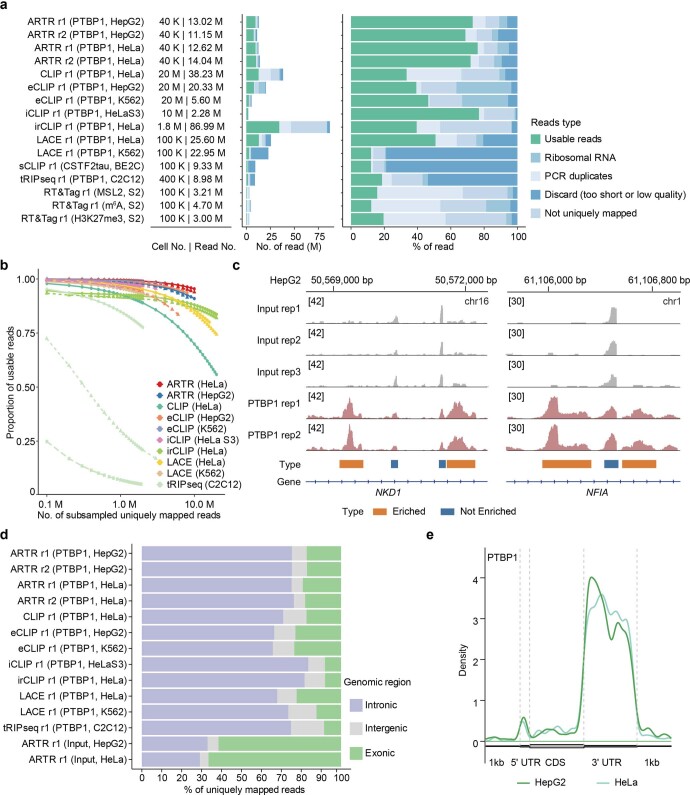
Extended Data Fig. 2. Reads comparison between ARTR-seq and other methods.
a, Bar plots showing numbers (left) and percentages (right) of the usable reads and reads filtered after each processing step for libraries constructed by using ARTR-seq, CLIP, eCLIP, iCLIP, irCLIP, LACE-seq, sCLIP, tRIP-seq, and RT&Tag, respectively. The usable reads are defined as reads uniquely mapped to the genome and remained after PCR deduplication. b, Percentages of usable reads in subsampled uniquely mapped reads from PTBP1 libraries constructed by ARTR-seq, CLIP, eCLIP, iCLIP, irCLIP, LACE-seq, sCLIP, and tRIP-seq, respectively. c, Snapshots from Integrative Genomics Viewer (IGV) showing the read coverage of ARTR-seq libraries. The read coverage of each library was normalized by its respective sequencing depth. All tracks were set to the same scale. Regions with higher read coverage in PTBP1 ARTR-seq libraries compared to the input libraries represent true positive RBP binding signals (enriched, orange); regions with lower or comparable read coverage indicate background noise signals (not enriched, blue). Input libraries were applied to help filter out not-enriched regions. d, A bar plot showing the usable reads distribution in the intronic (purple), intergenic (grey) and exonic (green) regions for libraries constructed by using ARTR-seq, CLIP, eCLIP, iCLIP, irCLIP, LACE-seq, sCLIP, and tRIP-seq, respectively. About 30% of usable reads for the ARTR-seq input samples were located in introns. e, Meta distributions of PTBP1 ARTR-seq peaks along mRNA transcripts and flanking 1 kb regions.

