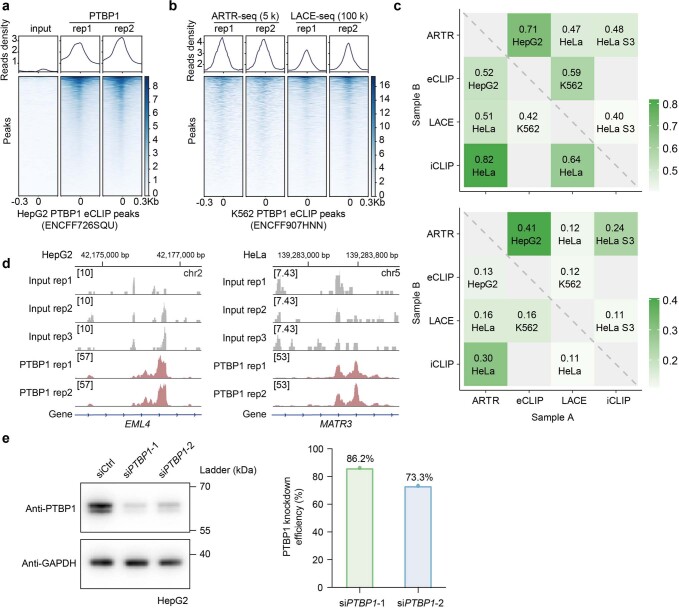
Extended Data Fig. 3. Comparison between ARTR-seq and other methods.
a. The signal profiles and heatmaps of read density from ARTR-seq library reads at the eCLIP-identified PTBP1 peaks in HepG2 cells28. b, Signal profiles and heatmaps of read density from ARTR-seq and LACE-seq library at the eCLIP-identified PTBP1 peaks in K562 cells13,28. c, Heatmaps exhibiting the transcriptome-wide pairwise overlap of PTBP1-targeted genes (top) or peaks (bottom) among libraries from ARTR-seq, eCLIP28, and LACE-seq13 and iCLIP27 using the same cell line. Notably, the iCLIP data from the HeLa S3 cell line was compared with ARTR-seq using the HeLa cell line and LACE-seq using the HeLa cell line. The overlap proportion was determined as the number of detected genes (or peaks) overlapped between sample A and sample B divided by the total number of detected genes (or peaks) in sample A. The maximum gap between overlapping peaks was set at 200 nt. The overlap proportion of genes (or peaks) and the cell line of sample A were labeled in the corresponding position. d, IGV snapshots showing the read coverage of ARTR-seq libraries corresponding to Fig. 2c. The read coverage of each library was normalized by its respective sequencing depth. According to the ARTR-seq library types (input and PTBP1), the tracks were adjusted to distinct scales. e, Western blot (left) and quantification (right) displaying PTBP1 protein levels in control (siCtrl) and PTBP1 knockdown (siPTBP1) HepG2 cells. GAPDH was used as an internal control for normalization.

