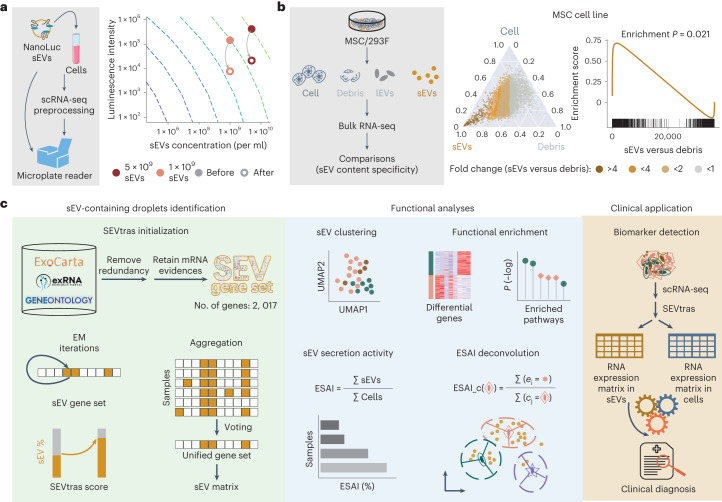
Fig. 1. SEVtras learns sEV transcriptome-wide patterns at single-droplet resolution.
a, Changes in luminescence after scRNA-seq preprocessing steps. NanoLuc-labeled sEVs were used to monitor the retention of sEVs during the scRNA-seq procedure. b, Transcriptional profile of sEVs is distinct. The left shows the comparisons between sEVs and debris in the MSC cell line. The middle (ternary plot) shows the expression of genes in MSC cell, sEVs and debris. The right (GSEA plot) shows the enrichment score of the SEV gene set in sEVs compared to debris in MSC. P indicates the family-wise error rate (FWER) P values in the GSEA using a hypergeometric test. c, Overview of SEVtras. The left panel shows what is initialed by the SEV gene set, SEVtras uses expectation–maximization (EM) iterations to identify sEV-containing droplets from massive cell-free droplets in scRNA-seq data. On achieving convergence through these iterations, SEVtras assigns a classification score to each droplet. To ensure the comparability of SEVtras scores across different samples, the results from each sample are aggregated through a voting and unification process. The middle panel shows the functional analyses for these droplets identified by SEVtras. The right panel shows that SEVtras enables large-scale screening of cell-sEV pairwise signatures in the clinic.

