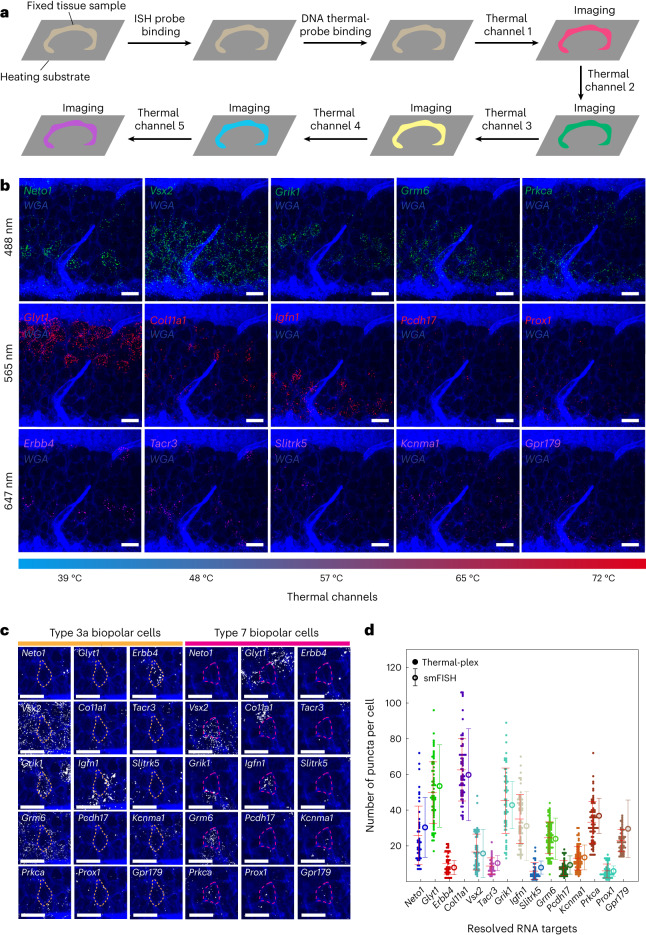
Fig. 6. Multiplexed imaging of 15 RNA targets in retina tissue with DNA thermal-plex.
a, Workflow of multiplexed RNA imaging with thermal-plex in retina tissue. b, Fluorescent images at five thermal and three fluorescent channels for the 15 RNA targets (Neto1, Vsx2, Grik1, Grm6, Prkca, Glyt1, Col11a1, Igfn1, Pcdh17, Prox1, Erbb4, Tacr3, Slitrk5, Kcnma1, Gpr179). Scale bars, 10 µm. c, Examples of classified type 3a and type 7 bipolar cells in the retinal tissue with the RNA imaged by thermal-plex. Scale bars, 10 µm. d, Quantitative RNA copy number per cell resolved with thermal-plex and comparisons with smFISH. Each dot represents the count in a single cell. Red horizontal lines represent the mean RNA copy numbers resolved by thermal-plex. Vertical lines indicate the statistic distributions of RNA puncta resolved by smFISH for each RNA. The numbers of cells used for quantification were n(Neto1) = 45, n(Glyt1) = 68, n(Erbb4) = 38, n(Vsx2) = 65, n(Col11a1) = 57, n(Tacr3) = 32, n(Grik1) = 58, n(Igfn1) = 69, n(Slitrk5) = 33, n(Grm6) = 85, n(Pcdh17) = 43, n(Kcnma1) = 71, n(Prkca) = 73, n(Prox1) = 48 and n(Gpr179) = 59. The number of cells was counted from at least three fields of view. The numbers of cells used for smFISH quantification were n(Nego1) = 18, n(Glyt1) = 39, n(Erbb4) = 17, n(Vsx2) = 29, n(Col11a1) = 17, n(Tacr3) = 18, n(Grik1) = 17, n(Igfn1) = 28, n(Slitrk5) = 22, n(Grm6) = 25, n(Pcdh17) = 20, n(Kcnma1) = 34, n(Prkca) = 69, n(Prox1) = 22 and n(Gpr179) = 22 (Extended Data Fig. 10). Data are presented as mean values ± s.d.

