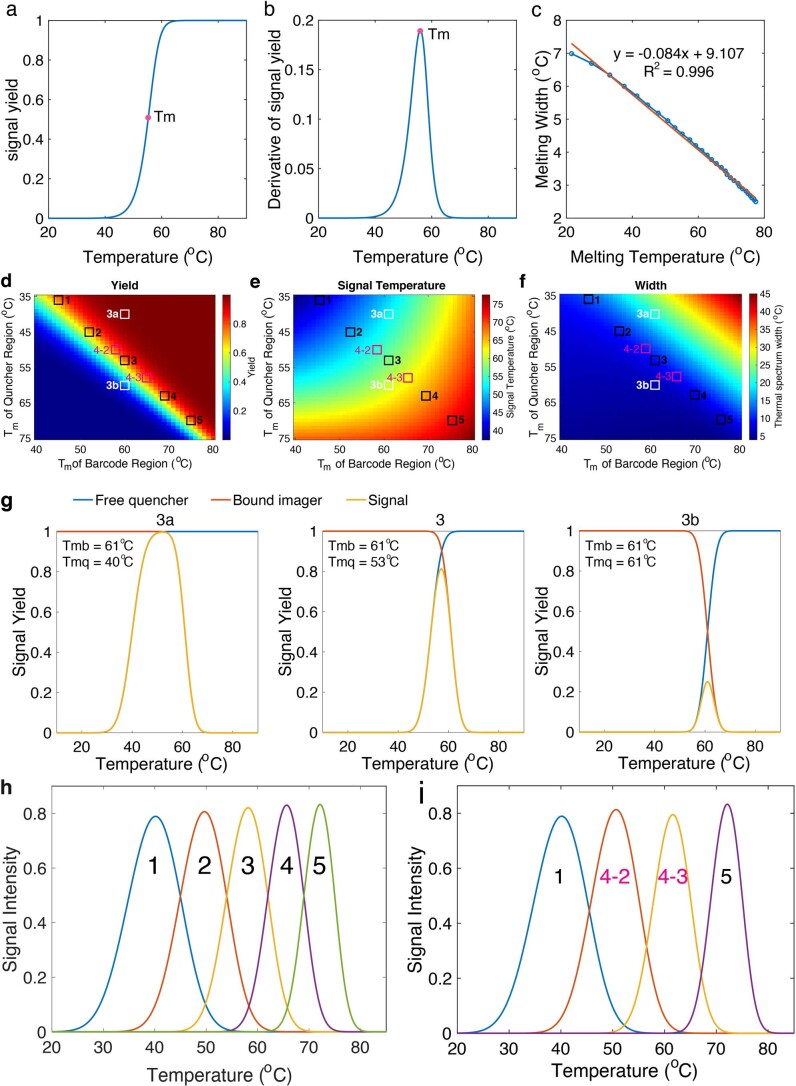
Extended Data Fig. 2. The thermal spectral of DNA thermal-plex imaging.
a. A typical melting curve with melting temperature of 57 °C. b. The derivative of the melting curve is fitted with the Gaussian function. c. The correlation between the width of melting curve and melting temperature. The signal yield (d), signal temperature (e), and width of the thermal spectra (f) with different combinations of quencher and DNA barcode melting temperature. See Supplementary Note 3 for detailed discussion. The selected representative melting profiles are shown in squares. g, Examples of three representative thermal spectra with different combinations of the quencher and binding domain melting temperatures. Examples 3a and 3b are suboptimal thermal spectra due to high spectrum width and low signal yield, respectively. The spectrum in 3 is a more optimal design with relatively higher signal yield and narrower width. h, The thermal spectra of five near optimal thermal channels (39 °C, 48 °C, 57 °C, 65 °C, 72 °C) with minimal crosstalk and relatively high signal yield. i, The thermal spectra of the four stringent combinations. The signal temperatures were determined to be 40 °C, 52 °C, 62 °C, and 72 °C.

