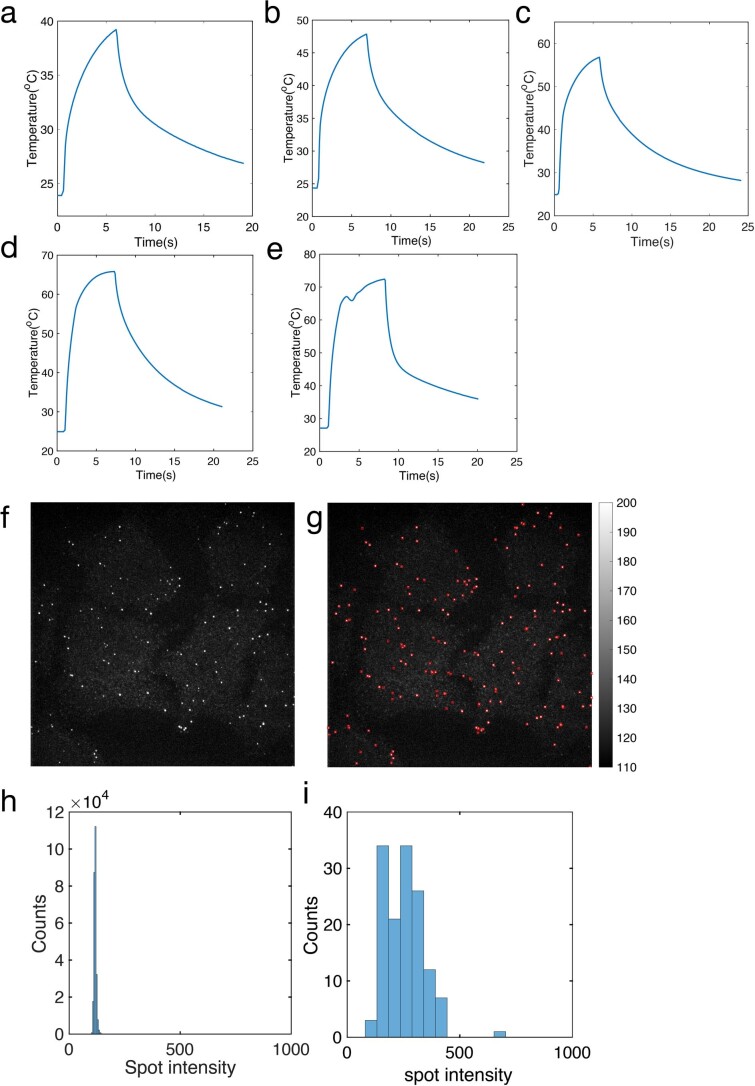
Extended Data Fig. 3. The temperature control and RNA image analysis.
a. Heating to signal temperature at 39 °C. b. Heating to signal temperature at 48 °C. c. Heating to signal temperature at 57 °C, d. Heating to signal temperature 65 °C, e. Heating to signal temperature 72 °C. The device rapidly heats to the desired temperature and melts off the quencher and imager strand in situ. f, Exemplary image of RNA FISH from DNA thermal-plex. g, RNA puncta that were identified by an intensity filter are indicated with red boxes. h, The histogram of all pixels in the field of view. i, Histogram of identified RNA spots.

