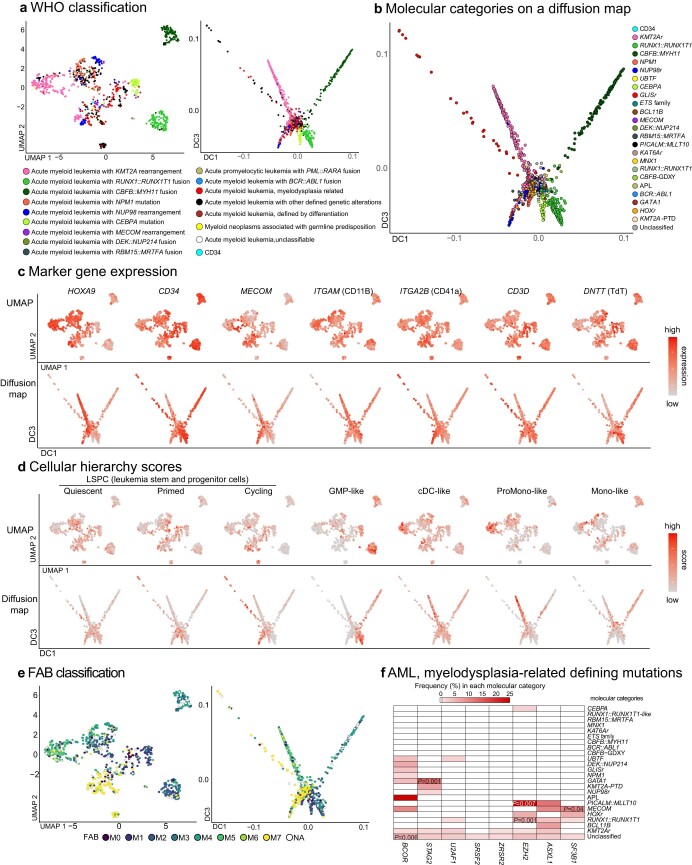
Extended Data Fig. 3. Transcriptional and mutational characterization of the study cohort.
a. UMAP (Uniform Manifold Approximation and Projection) plots and diffusion maps colored according to the WHO classification. b. A diffusion map colored according to molecular categories of the samples. DC: diffusion component, APL: acute promyelocytic leukemia. c. Expression of marker genes on UMAP plots and diffusion maps. Colors represent scaled expression levels. d. Cellular hierarchy scores inferred by CIBERSORT on UMAP plots and diffusion maps. Colors represent scaled scores. LSPC: leukemia stem and progenitor cell, GMP: granulocyte and macrophage projenitor, cDC: classic dendritic cell, ProMono: promonocyte, Mono: monocyte. e. UMAP plots and diffusion maps colored according to the French-American-British (FAB) classification f. A heatmap showing frequencies of defining gene alterations of AML, myelodysplasia-related in the WHO classification in each category. Colors denote the frequencies. Statistical significance was assessed by two-sided Fisher’s exact test to calculate P values of co-occurrence followed by the Benjamini-Hochberg adjustment for multiple testing to calculate q values. No pair remained significant (q < 0.05) after adjustment, and P values (<0.05) are shown instead.

