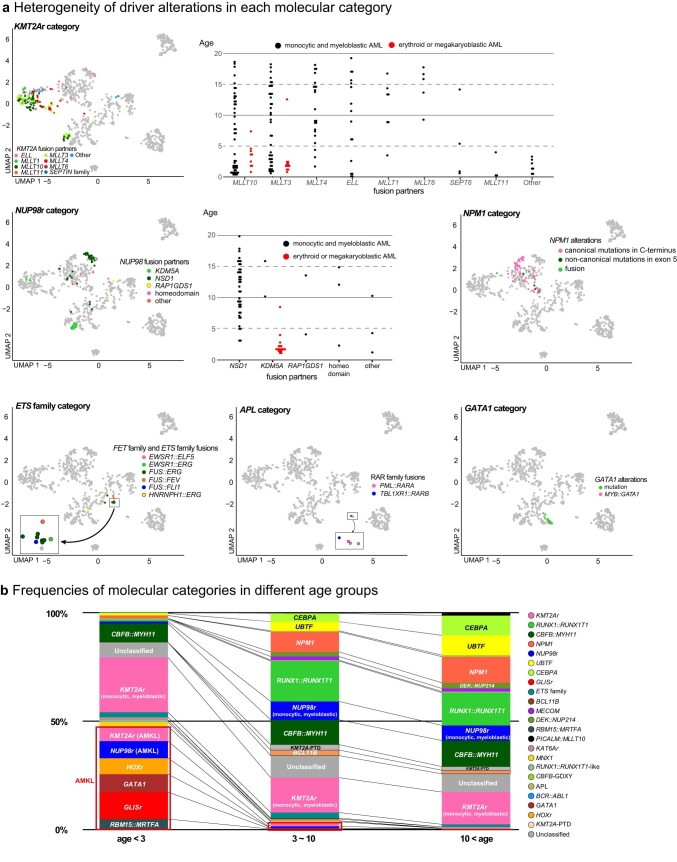
Extended Data Fig. 4. Details of molecular categories.
a. Details of molecular categories with multiple category-defining alterations. The distribution on the UMAP plot according to fusion partners (KMT2Ar, NUP98r, ETS family, and APL categories) or mutation and fusions (NPM1 and GATA1 categories) are shown with colors representing the types of alterations. Age distributions according to fusion partners are also shown for KMT2Ar and NUP98r. Acute megakaryocytic/erythoid leukemia (AMKL/AEL) cases are shown separately in red. b. Proportion of molecular categories among different age groups (left: age<3, middle: 3<age<10, right: 10<age). Each column is colored according to the molecular categories, and categories associated with AMKL/AEL phenotypes are highlighted in a red square. Representative category names are shown in the columns.

