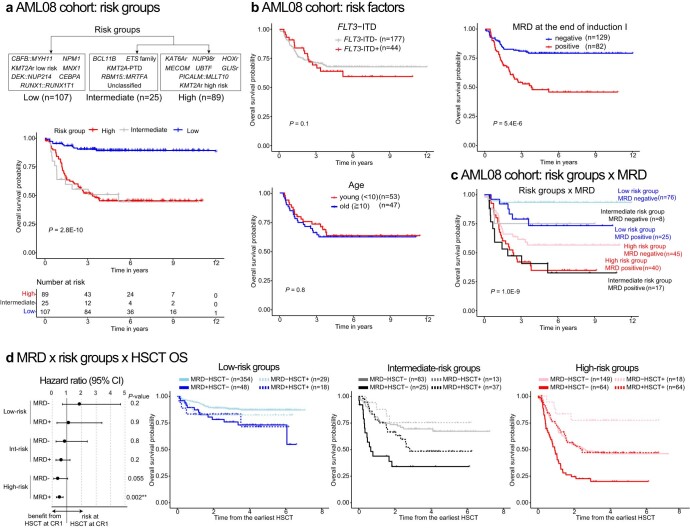
Extended Data Fig. 10. Validation of the prognostic model.
a. Grouping of molecular categories into Low, Intermediate, and High-risk groups (top) and Kaplan-Meier curves of overall survival of patients in each risk group (bottom) in the AML08 cohort. b. Kaplan-Meier curves and statistical significance of overall survival of patients with known prognostic factors (FLT3-ITD status: top-left, age: bottom-left, MRD (minimal residual disease) positivity at the end of the induction I: top-right) in the AML08 cohort. C. Kaplan-Meier curves of overall survival of patients in six risk strata using risk groups (Low-Intermediate-High) and MRD (measurable residual disease) positivity in the AML08 cohort. d. Outcomes in each risk group depending on MRD and HSCT (hematopoietic stem cell transplant) status in the AAML1031 cohort. left-Hazard ratio (dot) and 95% confidence intervals (lines) in each group. right-Kaplan-Meier curves of overall survival. Survival curves start from the earliest transplant day within the cohort (day 96) and exclude patients who died before that timepoint. For survival curves in a-c, statistical significance was assessed by the log-rank test, and P values are shown in the plots. For d, the statistical significance of HSCT in each risk group was assessed by incorporating HSCT status as time-dependent variables and shown next to the hazard ratio plot. For survival analysis involving MRD status, patients with available MRD status (MRD+:n = 273, MRD-: n = 703) are included.

