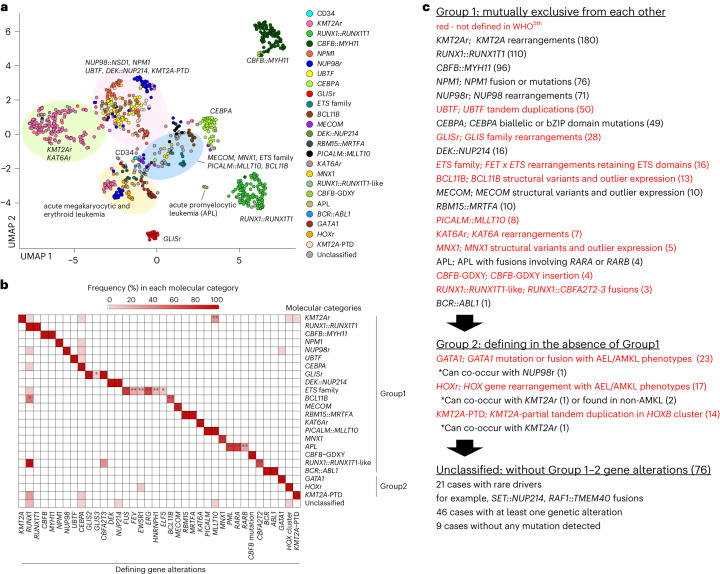
Fig. 2. Molecular categories defined by mutually exclusive gene alterations.
a, UMAP plot of the entire pAML cohort (n = 887) and cord blood CD34+ cells (normal controls: n = 5) using the top 315 variable genes. The colors of each dot denote the molecular categories of the samples. Representative category names are shown, and large clusters enriching specific categories are highlighted in circles (pink: NUP98::NSD1, NPM1, UBTF, DEK::NUP214, KMT2A-PTD; green: KMT2Ar and KAT6Ar; yellow: categories with acute megakaryocytic or erythrocytic expression; blue: MECOM, MNX1, ETS family, PICALM::MLLT10, BCL11B). b, Heatmap showing frequencies of defining gene alterations represented by color. Statistical significance was assessed by two-sided Fisher’s exact test to calculate P values of co-occurrence, followed by Benjamini–Hochberg adjustment for multiple testing to calculate q values (*P < 0.05, **q < 0.05). c, Definition of molecular categories and diagnostic workflow. Molecular categories not defined in WHO5th are highlighted in red. APL, acute promyelocytic leukemia.

