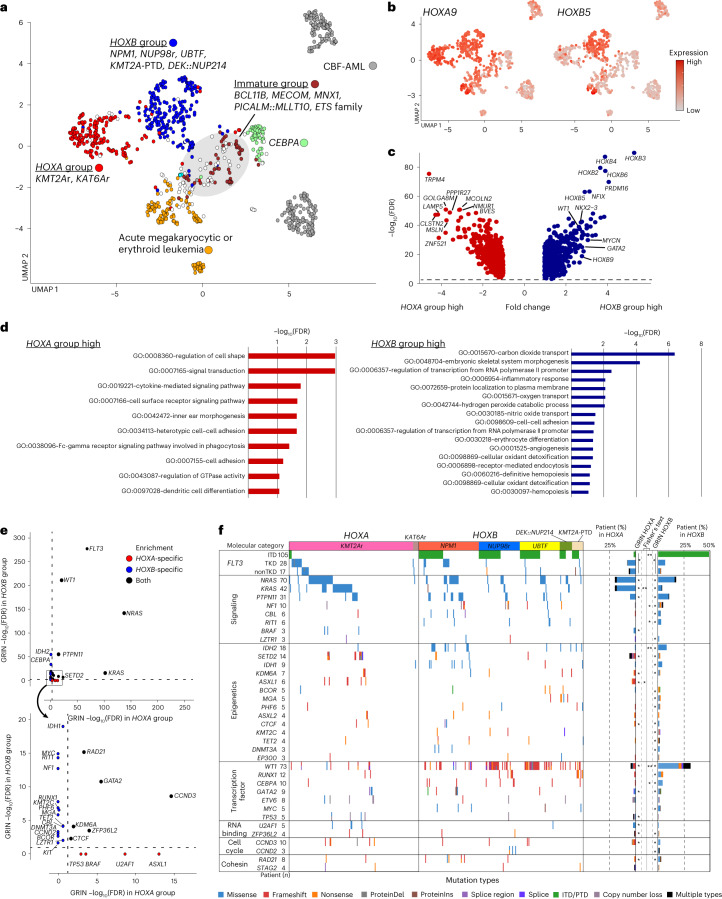
Fig. 5. Categories demarcated by HOXA and HOXB cluster expression.
a, UMAP plot colored according to groups of molecular categories based on UMAP clustering and HOX cluster gene expression profiles. A gray circle indicates a cluster enriching categories with immature phenotypes (BCL11B, MECOM, MNX1, PICALM::MLLT10, ETS family). b, HOXA9 and HOXB5 expression on UMAP plots. Dot colors represent the relative expression of the genes. c, Volcano plot showing differentially expressed genes between HOXA and HOXB groups. Genes with absolute fold change >2 and FDR < 0.05 are considered differentially expressed. Red or blue dots show genes enriched only in either HOXA or HOXB groups, respectively, and representative gene names are shown. d, Gene Ontology term analyses of genes with significantly high expression in HOXA (red) and HOXB (blue) categories by DAVID (Database for Annotation, Visualization and Integrated Discovery). Bars represent logged FDR. e, Plots showing the results of GRIN analyses in the HOXA group (horizontal axis) and HOXB group (vertical axis). Genes with FDR < 0.05 in either the HOXA or HOXB group are shown. Red or blue dots show genes enriched only in either the HOXA or HOXB group, respectively. Dotted lines represent thresholds for statistical significance (FDR < 0.05). f, Mutational heatmap comparing patterns between the HOXA and HOXB groups. Colors represent mutation types, and molecular categories are annotated on the top. Bar plots on the right show frequencies of mutations in the HOXA and HOXB groups. Statistical significance of GRIN analysis in the HOXA and HOXB groups (*FDR < 0.05) and two-sided Fisher’s exact test between HOXA and HOXB groups (*P < 0.05, **q < 0.05 after Benjamini–Hochberg adjustment) are also shown. GRIN results for FLT3 are for the entire gene, whereas Fisher’s tests were performed separately for ITD, TKD and non-TKD mutations.

