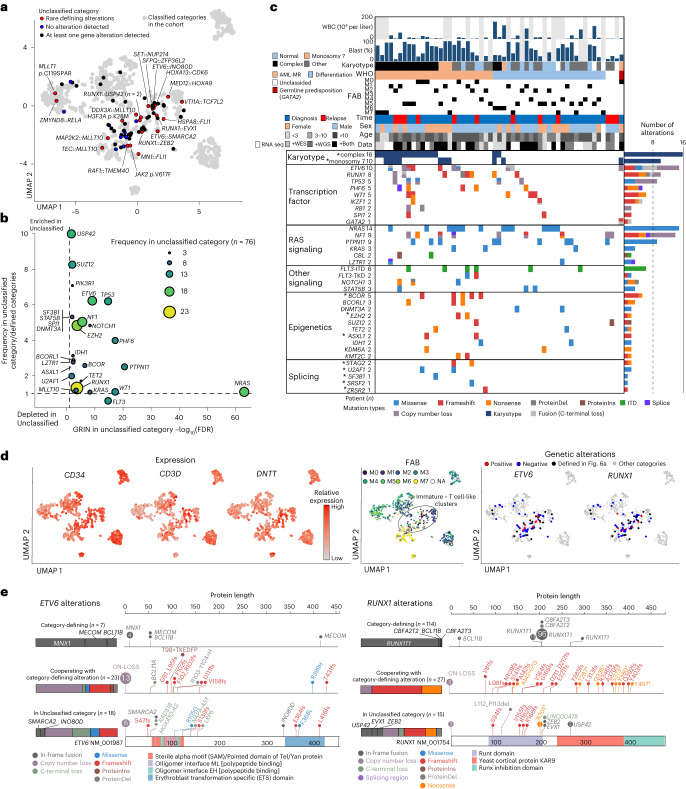
Fig. 6. Characterization of cases without category-defining alterations.
a, UMAP plot showing cases without category-defining alterations. Red dots represent cases with rare recurrent gene alterations, blue dots represent cases for which no pathogenic alteration was found and black dots represent cases with at least one gene alteration not defining the phenotype. Gray dots represent cases with classified categories. b, Plot showing the FDR of GRIN analysis for the Unclassified category (horizontal axis) and relative enrichment of the alteration in the unclassified category (vertical axis). Dot sizes and colors denote the Unclassified category’s frequency, which included fusions, mutations, copy-number loss and gain, and copy-neutral heterozygosity. c, Mutational heatmap of the Unclassified cases, including complex karyotypes and monosomy 7. Patients’ clinical and demographic data are shown on the top. Colors represent mutation types. Defining alterations for AML-MR are marked by asterisks. d, UMAP plots showing CD34, CD3D and DNTT expression (left), FAB classification (middle) and cases with ETV6 alterations and RUNX1 alteration (right). For ETV6 and RUNX1 alteration plots, cases with classified categories are shown as gray dots. e, Patterns of alteration in ETV6 (left) and RUNX1 (right). Category-defining fusions are shown in the top row, alterations co-occurring with category-defining alterations in the middle row, and alterations in the Unclassified category in the bottom row. Bars represent a relative fraction of alteration in each group and colors denote the alteration types. WBC, white blood cell.

