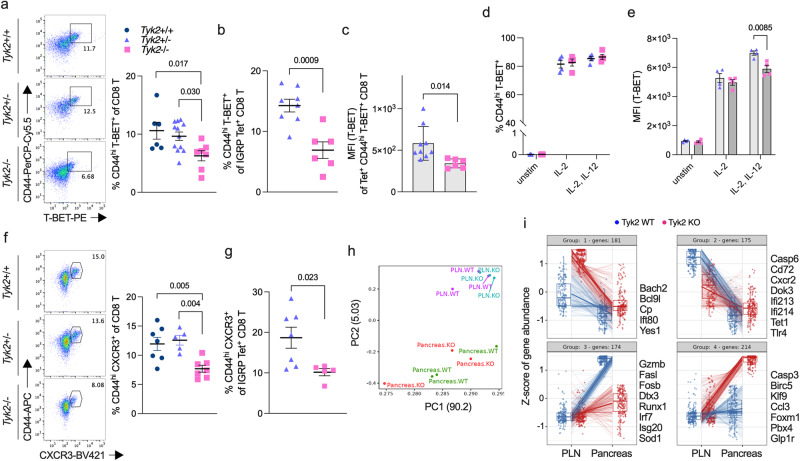
Fig. 5. Defective development of CD8+ T-BET+ CTLs in the PLN and effector function of CD8+ CTLs in the pancreas of Tyk2-deficient NOD mice.
a (Left) Representative flow cytometry plots and (right) graph indicate the frequency of CD44hi T-BET+ polyclonal cells among CD8+ T cells in the PLN of 6w female mice (Tyk2+/+, n = 6; Tyk2+/−, n = 12; Tyk2−/−, n = 7). b Frequency of CD44hi T-BET+ cells among IGRP-specific CD8+ T cells in the PLN of 6w female mice (Tyk2+/−, n = 8; Tyk2−/−, n = 6). c Protein expression levels of T-BET in CD44hi T-BET+ IGRP-specific CD8+ T cells in the PLN of 6w female mice (Tyk2+/−, n = 9; Tyk2−/−, n = 6). Frequency of CD44hi T-BET+ cells (d) and protein expression levels of T-BET (e) in unstimulated or ex vivo-activated Tyk2+/− or Tyk2−/− CD8+ T cells with anti-CD3/CD28 beads and IL-2 in the presence or absence of IL-12 for 3d (Tyk2+/−, n = 4; Tyk2−/−, n = 4). f (Left) Representative flow cytometry plots and (right) graph indicate the frequency of CD44hi CXCR3+ cells among polyclonal CD8+ T cells in the PLN of 6w female mice (Tyk2+/+, n = 7; Tyk2+/−, n = 5; Tyk2−/−, n = 7). g Frequency of CD44hi CXCR3+ cells among IGRP-specific CD8+ T cells in the PLN of 6w female mice (Tyk2+/−, n = 7; Tyk2−/−, n = 5). h PCA of transcriptome data of purified CD44hi IGRP-specific CD8+ T cells in the PLN (Tyk2+/+, n = 3; Tyk2−/−, n = 3) and IGRP-specific CD8+ T cells in the pancreas (Tyk2+/+, n = 3; Tyk2−/−, n = 3). Gene expression profiles in the purified cells were analyzed by RNA-seq analysis. i Box plots show the pattern of differentially expressed genes in IGRP-specific CD8+ T cells in the PLN (Tyk2+/+, n = 3; Tyk2−/−, n = 3) and pancreas (Tyk2+/+, n = 3; Tyk2−/−, n = 3). Likelihood ratio tests were used to determine differentially expressed genes between the genotypes (FDR < 0.1, fold change >1.5). Selected genes are highlighted on the right side of each box plots. Boxes and whiskers represent the median and the lower and upper hinges correspond to the 25th and 75th percentiles. The whiskers extend from the hinges to the values no further than 1.5 times the inter-quartile ranges from each box hinge. Data represent the mean ± SEM. P-values were calculated using one-way ANOVA with Dunnett’s posttest (a, f) and two-tailed Student’s t test (b–e, and g).

