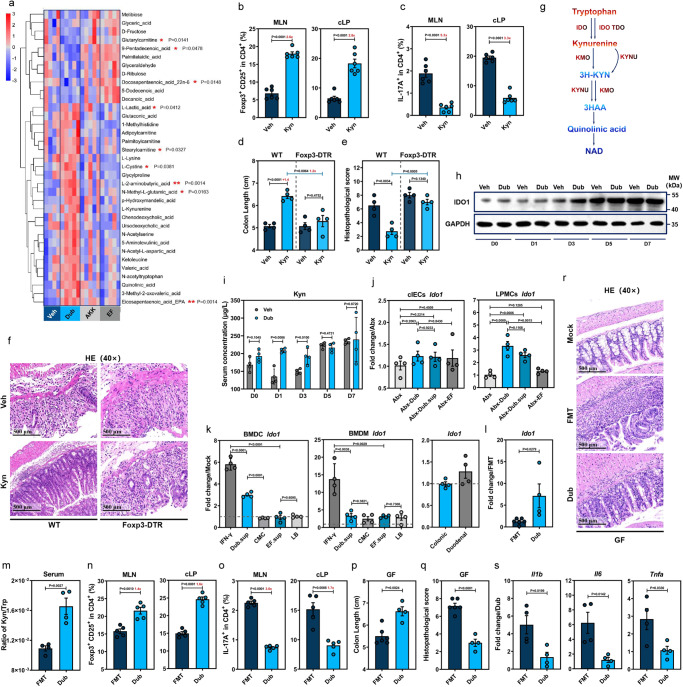
Fig. 4. D. newyorkensis promotes CD25+Foxp3+ Tregs through enhancement of IDO1-mediated Trp metabolism in dendritic cells.
a Heat map showing differential metabolites in colon at D7 post-DSS treatment from wild-type C57BL/6J mice (WT) treated with vehicle (Veh, n = 4) or colonized with D. newyorkensis (Dub), A. muciniphila (Akk), or E. faecalis (EF) (n = 5). Corresponding statistical annotations of differential metabolites represent the distinctions between Dub-colonized and noncolonized mice. b, c T cell subsets in mesenteric lymph nodes (MLN) and colonic lamina propria (cLP) from Veh- or Kyn-treated (10 mg/kg) conventional WT mice were examined by flow (n = 6). d–f WT or DT-treated Foxp3-DTR mice (n = 4) were treated with Kyn and subjected to DSS administration for 7 days, colon length (d) and histopathology (e, f) were examined. g Schematic of the Kyn catabolic pathway of Trp metabolism. h, i Kinetics of colonic IDO1 expression (h) and Kyn serum concentration (i) in Dub- or Veh-colonized conventional WT mice (n = 4) at indicated times post-DSS administration. j IDO1 expression in colonic intestinal epithelial cells (cIECs) or lamina propria mononuclear cells (cLPMCs) extracted from Abx-Dub, Abx-EF, Abx-Veh, or Abx-Dub.sup mice (n = 4) at D3 post-DSS administration. k Ido1 expression in murine bone marrow-derived macrophages (mBMDMs) and bone marrow-derived dendritic cells (mBMDCs) or intestinal organoids treated with Dub or EF culture supernatants for 18 h. l–s Germ-free (GF) mice receiving fecal microbiota transplantation (FMT, n = 6) from conventional WT mice or colonized with Dub (n = 4) were exposed to DSS treatment for 7 days. Ido1 expression in cLPMCs (l), serum concentration ratio of Kyn/Trp (n = 4) (m), T cell subsets (n = 5) (n, o) in MLN and cLP, colon length (p), pathological changes (q, r) (FMT, n = 6; Dub, n = 4) and proinflammatory cytokines in cLPMCs (n = 4) (s) were determined. Fold of change in frequencies of T cell subsets (b, c, n, o) or colon length (d) between groups was calculated and presented with numbers in red. Dashed lines at 1 indicate that the treatments have equal value as normalized controls. Results are representative of data generated in at least two independent experiments and are expressed as mean ± SEM, and 2-sided P-values were examined by the Student’s t-test. Source data are provided as a Source Data file.

