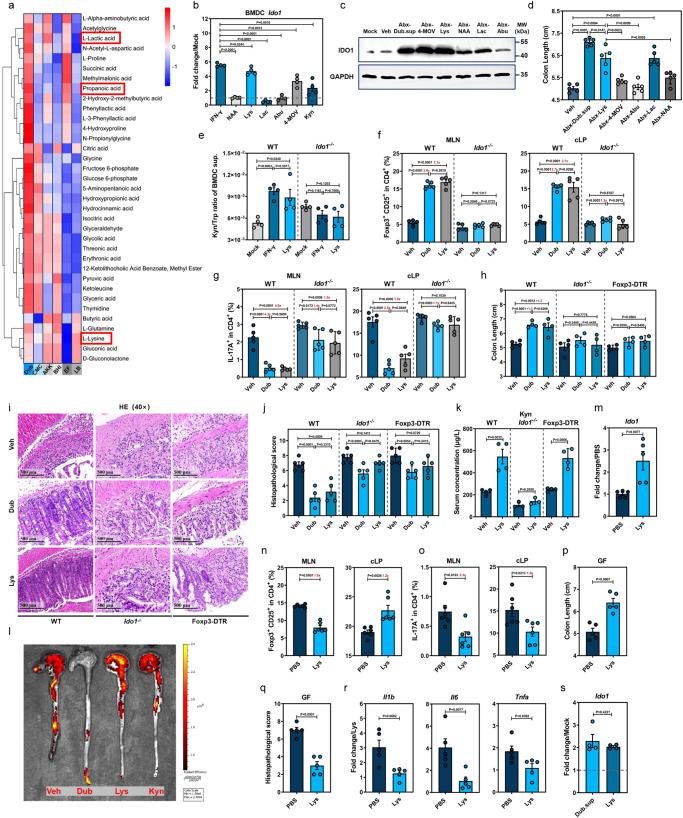
Fig. 5. L-Lys enhances Trp metabolism in dendritic cells to induce Treg-dependent immunosuppression by promoting IDO1 expression.
a Heat map showing differentially expressed metabolites of D. newyorkensis (Dub), A. muciniphila (Akk), E. faecalis (EF) and respective cultured supernatants (chopped meat carbohydrate broth, CMC; brain heart infusion medium, BHI; Luria–Bertani medium, LB) at 48 h. b Ido1 expression in mouse bone marrow-derived dendritic cells (BMDCs) treated with N-acetyl-L-Asp (NAA; 1 mM), L-Lys (8 mM), L-lactic acid (Lac; 100 mM), L-α-aminobutyric acid (Abu; 0.1 mM), ketoleucine (4-MOV; 3 mM) and Kyn (0.2 mM) (n = 4). c, d IDO1 expression and colon length of Abx mice treated with metabolites were measured at D3 or D7 post-DSS administration, respectively (n = 5). e IDO1 activity in BMDCs treated with Lys or IFN-γ was determined by Kyn/Trp ratio of cell culture supernatant (n = 4). f–j Conventional WT, DT-treated Foxp3-DTR, or Ido1−/− mice were colonized with Dub or treated with Lys (20 mg/kg) and subjected to DSS administration for 7 days. T cell subsets (f, g) in mesenteric lymph nodes (MLN) and colonic lamina propria (n = 5) (cLP) colon length (n = 4) (h) and histopathology (n = 5) (i–j) were determined. k Serum Kyn concentration of Lys-treated conventional WT, DT-treated Foxp3-DTR or Ido1−/− mice before DSS exposure (WT, Foxp3-DTR, n = 4; Ido1−/−, n = 3). l In vivo imaging of colon from vehicle (Veh)-, Dub-, Lys- or Kyn-treated transgenic IL-17-EGFP mice. m–r Lys- or Veh-treated germ-free mice were exposed to DSS treatment for 7 days and colonic Ido1 expression (n = 5) (m), T cell subsets (n = 6) in MLN and cLP (n, o), colon length (p), histopathology (q) and proinflammatory cytokines (n = 5) (r) were evaluated. s Ido1 expression in Lys- (8 mM) or Dub supernatant (Dub.sup)-treated bone marrow-derived dendritic cells (BMDCs) extracted from GF mice at 18 h post-treatment (n = 4). Fold of change in frequencies of T cell subsets (f, g, n, o) or colon length (h) was calculated and presented with numbers in red. Dashed lines at 1 indicate that the treatments have equal value as normalized controls. Results are representative of data generated in three independent experiments and are expressed as mean ± SEM, and 2-sided P-values were examined by the Student’s t-test. Source data are provided as a Source Data file.

