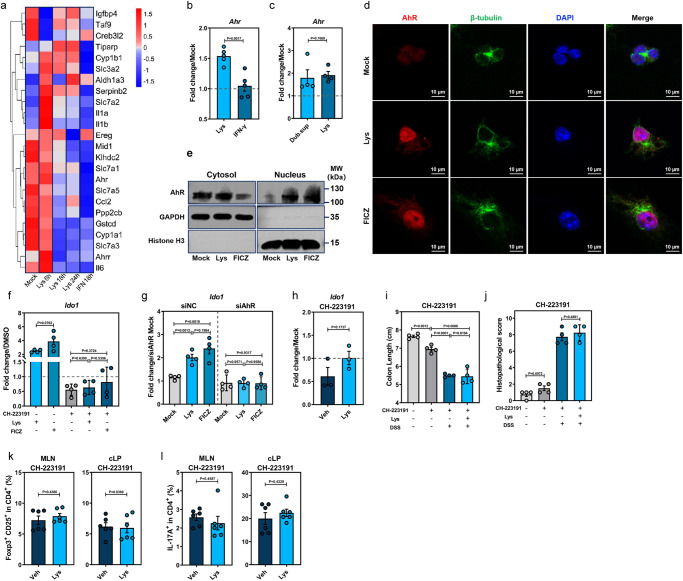
Fig. 6. L-Lys activates the AhR-IDO1 axis in DCs to induce immunosuppressive Treg responses.
a Transcriptomic analysis of mock-, Lys-, IFN-γ-treated mouse BMDCs at indicated times post-treatment (mock, n = 3; Lys 6 h, 18 h, 24 h, IFN 18 h, n = 4). b Ahr expression in Lys- or IFN-γ-treated BMDCs extracted from conventional WT mice (n = 5). c Ahr expression in Lys- or Dub.sup-treated BMDCs extracted from GF mice (n = 4). d Translocation of AhR (red) into the nucleus (DAPI, blue) from cytoplasm (β-tubulin, green) of mouse BMDCs after 6 h treatment with Lys or the AhR agonist 6-formylindolo[3,2-b]carbazole (FICZ). e AhR protein analysis in nuclear and cytoplasmic fractions of mock-, Lys-, or FICZ-treated mouse BMDCs at 6 h post-treatment by western blot. f Expression of Ido1 in mouse BMDCs treated with Lys, FICZ, or the AhR antagonist CH-223191, or a combination of CH-223191 and Lys/FICZ (n = 4). g Expression of Ido1 in mouse BMDCs transfected with negative control (siNC) or AhR-specific small interfering RNA (siAhR) and treated with Lys or FICZ at 18 h post-treatment (n = 4). For the experiments shown in (a–g) above, the following were used: Lys (8 mM), FICZ (300 nM), and CH-223191 (10 μM). For experiments shown in (h–l) below, conventional WT mice (n = 6–8) were treated with Lys (20 mg/kg), CH-223191 (10 mg/kg), or Lys plus CH-223191 and subjected to DSS administration. h Expression of Ido1 in the cLPMCs from Veh- or Lys-treated WT mice at D3 post-DSS administration in the presence of CH-223191 (n = 3). Colon length (i), histopathological changes by HE staining (n = 4) (j), CD25+Foxp3+Tregs (k) and IL-17+ CD4+ T cells (n = 6) (l) in MLN and cLP of Veh- or Lys-treated conventional WT mice in the presence of CH-223191 were examined at D7 post-DSS treatment. Dashed lines at 1 indicate that the treatments have equal value as normalized controls. Results are representative of data generated in three independent experiments and are expressed as mean ± SEM, and 2-sided P-values were examined by the Student’s t-test. Source data are provided as a Source Data file.

