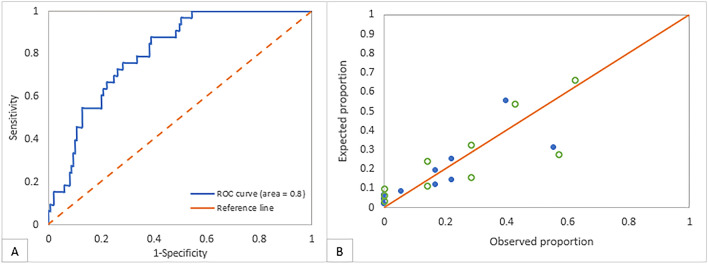
Figure 1.
(A) The receiver operating characteristic (ROC) curve of the predictive model with an area under the curve = 80.4% (suggesting very good discrimination), sensitivity = 87.9%, and specificity = 61.1%. (B) The calibration curve of the predictive model showing the degree of consistency between the observed proportion and the expected proportion of patients with postoperative diplopia using the predictive model in both the development and validation datasets (Full circles indicate datapoints from the development dataset; Empty circles indicate datapoints from the validation dataset; Hosmer–Lemeshow test P > 0.05 suggesting goodness-of-fit).

