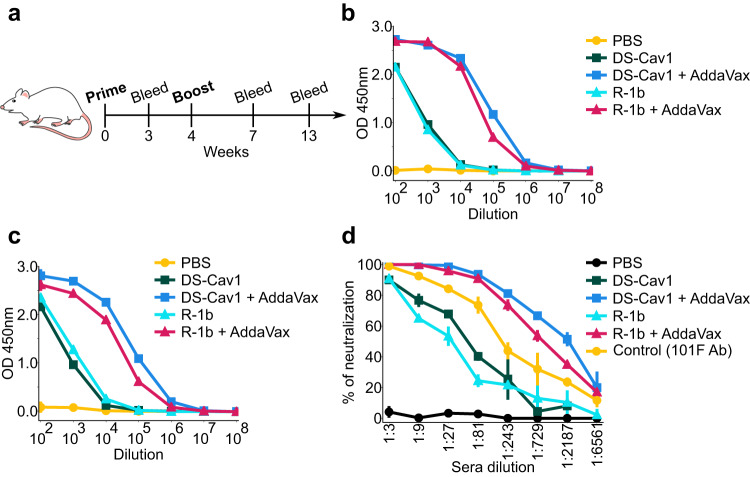
Fig. 4. Immunogenicity assessment of RSV F variants in a mouse model using 0.2 µg doses.
a Schematic diagram of vaccination study schedule. Mouse cartoon was created with ChemDraw 20.067 through licensing with the University of Georgia. b Serum RSV-specific IgG measured by ELISA three weeks post-boost. c Serum RSV-specific IgG measured by ELISA nine weeks post-boost. d Serum neutralization titers determined using RSV A (rA2 strain L19F) and sera from mice nine weeks post-boost. Ab stands for antibody. The markers on each line plot indicate mean values while the vertical lines represent the standard deviation. Values were calculated from three repetitions using pooled serum samples from mice within each immunization group (5 animals/group). Source data for panels b–d are provided as a Source Data file.

