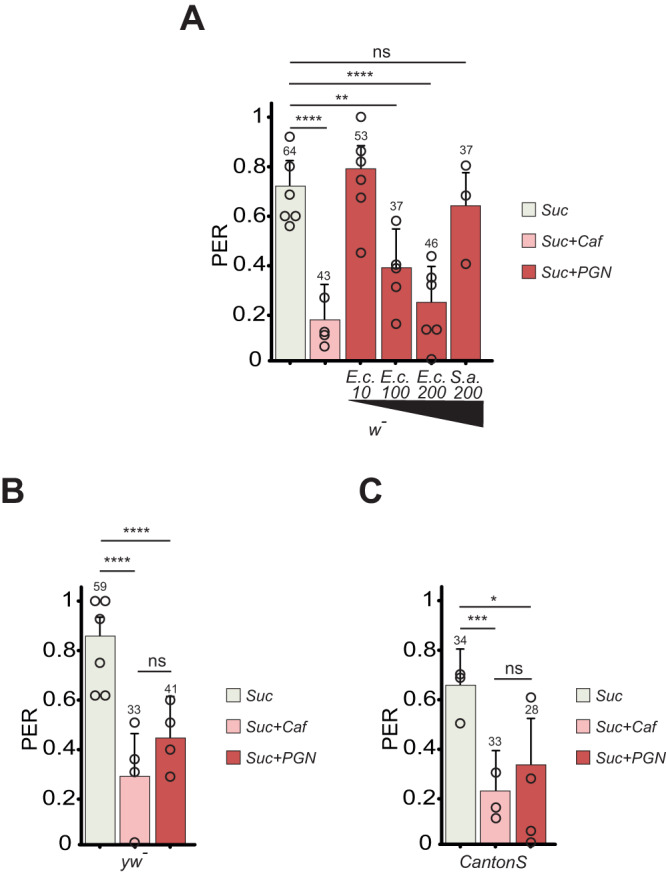
Fig. 1. E. coli PGN is aversive to the fly.

Dose-dependent PGN inhibition of PER. A PER index of w- flies to control solutions of sucrose 1 mM and sucrose 1 mM + caffeine 10 mM and to sucrose 1 mM + increasing concentrations of PGN from E. coli K12 (E.c) and S. aureus (S.a). The numbers below the x-axis correspond to the PGN final concentrations in µg/mL. B, C Aversion to PGN is independent of genetic background. PER index of yw- (B) and CantonS (C) flies to control solutions of sucrose 1 mM and sucrose 1 mM + caffeine 10 mM and to sucrose 1 mM + PGN from E. coli K12 at 200 µg/mL. The PER index is calculated as the percentage of flies tested that responded with a PER to the stimulation ± 95% confidence interval (CI). The total number of tested flies (n) for one condition is indicated on top of each bar. As the values obtained from one fly are categorical data with a Yes or No value, we used the Fisher exact t-test and the 95% CI to test the statistical significance of a possible difference between a test sample and the related control. At least 3 independent experiments were performed. The results from all the independent experiments were gathered and consequently, we do not show the average response from one experiment representative of the different biological replicates, but an average from all the data generated during the independent experiments in one graph. However, each open circle represents the average PER of one experiment. A PER value of 1 means that 100% of the tested flies extended their proboscis following contact with the mixture, a value of 0,2 means that 20% of the animals extended their proboscis. The number of tested flies (n) is indicated on top of each bar. ns indicates p > 0.05, *p < 0.05, **p < 0.01, ***p < 0.001, ****p < 0.0001 two-sided Fisher Exact Test. Further details including raw data and exact p-values can be found in the source data file.
