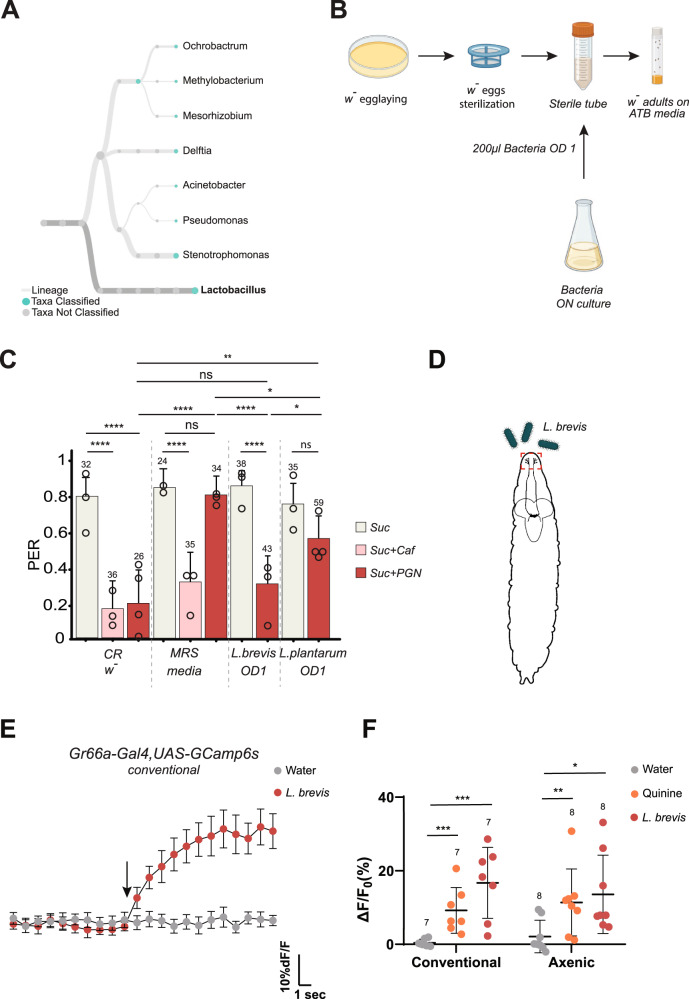
Fig. 7. Larval colonization by Lactobacillus brevis is sufficient to prime adult gustatory response to PGN.
A Lactobacilli are among the most abundant genera in our conventional raising conditions. Graphical representation of the bacterial genera present in our conventional raising conditions according to 16 S sequencing. B Graphical representation of the protocol for the mono-association of germ-free larvae with a given bacterial species. After oviposition the embryos are sterilized with bleach and transferred under sterile conditions into a fresh sterile tube then 200 µL of bacterial culture at OD 1 is added. Adults emerging from pupae are then transferred on antibiotic-enriched media. C Mono association of Germ-free larvae with L. brevis is sufficient to obtain adults responsive to PGN. PER index of w- flies mono-associated with L. brevis, L. plantarum or exposed to their culture media (MRS) to sucrose 1 mM and sucrose 1 mM + caffeine 10 mM and to sucrose 1 mM + PGN from E. coli K12 at 200 µg/mL. D Representation of a late L2 larvae with schematic of the brain and projections from taste neurons at the periphery to the CNS. In red is the area chosen to image the GCaMP6s signal following exposure to water, quinine or L. brevis. E Averaged ± SEM time course of the GCaMP6s intensity variations (ΔF/F0 %) for Gr66a+ neurons in conventionally raised larvae. The addition of water (n = 7), or L. brevis (OD1) (n = 7) at a specific time is indicated by the arrow. F Averaged fluorescence intensity of positive peaks ± SEM for Gr66a+ neurons following treatments in conventionally raised (water n = 7, Quinine (3 mM) n = 7 or L. brevis (OD1) n = 7) or axenic larvae (water n = 8, Quinine (3 mM) n = 8) or L. brevis (OD1) n = 8). For (C) PER index is calculated as the percentage of flies tested that responded with a PER to the stimulation ± 95% CI. The number of tested flies (n) is indicated on top of each bar. For each condition, at least 3 groups with a minimum of 10 flies per group were used. In (C), ns indicates p > 0.05, * indicates p < 0.05, ** indicates p < 0.01, **** indicates p < 0.0001 two-sided Fisher Exact Test. In (F), * indicates p < 0.05, ** indicates p < 0.01, *** indicates p < 0.001, non-parametric t-test, two-tailed Mann-Whitney test. Further details including raw data and exact p-values can be found in the source data file.

