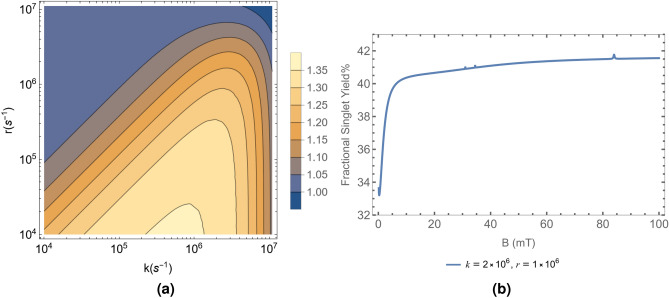
Figure 2.
(a) Ratio of percentages, S plotted in the plane. The lighter yellow areas are closer in value to the ratios seen in Tables 1 and 2. (b) Variation of percentage with magnetic field strength ranging from 0.15 to 100 mT. The figure is plotted with and , which corresponds to . All the figures are plotted considering the HFI contribution from the hydrogen atom of the Tyrosine oxyradical with the highest HFCC, mT. We also consider the contribution of the 25Mg isotope at its natural abundance of 10%. The HFI contribution from the same is mT.

