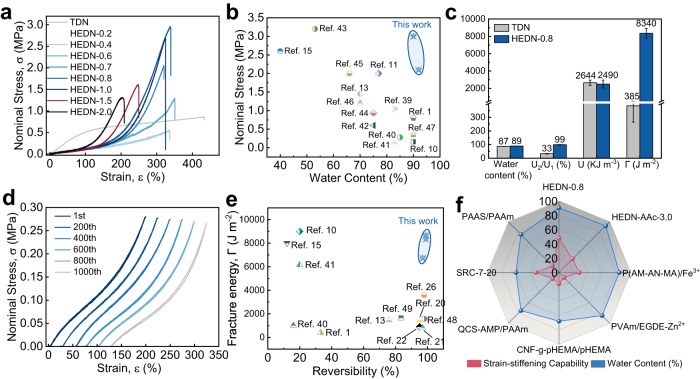
Fig. 2. Mechanical properties of HEDN hydrogels.
a Tensile stress‒strain curves of TDN hydrogel and HEDN hydrogels with different AMPS contents. Note: Preparation parameters of TDN hydrogel: 1st AMPS (1 M) MBAA (4 mol%), 2nd AAm (4 M) MBAA (0.05 mol%). b Ashby diagrams of nominal stress versus water content of previously-reported DN hydrogels. c Comparison of water content, reversibility (U2/U1), toughness (U), and fracture energy (Γ) between TDN hydrogels and HEDN-0.8 hydrogel. Error bars represent mean +/− standard deviation (n = 5). d One thousand consecutive loading-unloading cycles for the HEDN-0.8 hydrogel at 200% strain. Shifts are applied to the 200th, 400th, 600th, 800th, and 1000th cycle curves. e Ashby diagrams of fracture energy versus reversibility in previously-reported hydrogels. Hydrogels with very high toughness but very low reversibility were excluded. f Radar charts showing the strain-stiffening capability and water content parameters across hydrogels with strain-stiffening behavior (details in Supplementary Table 3).

