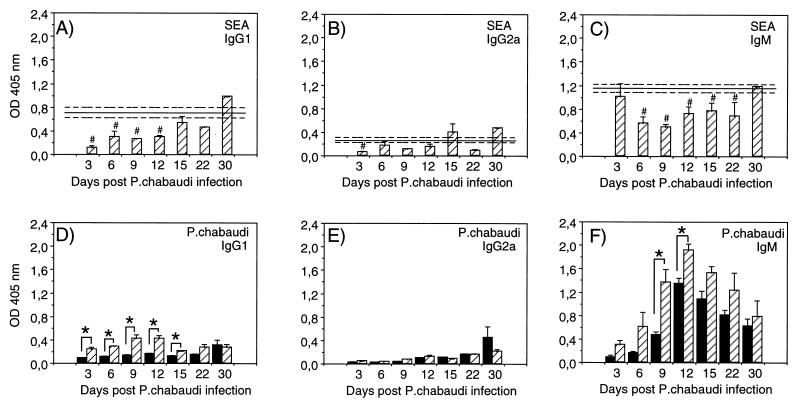
FIG. 2.
SEA- and P. chabaudi-specific antibodies in serum samples from mice with P. chabaudi infection only (■) or with concurrent S. mansoni-P. chabaudi infection ( ). Anti-SEA (A to C) and anti-P. chabaudi (D to F) antibodies were measured by ELISA. IgG1 (A and D), IgG2a (B and E), and IgM (C and F) levels were determined and are presented as absorbance (OD) at 405 nm. Results shown were obtained from serum dilutions of 1:1,000 for SEA-specific IgG1 and IgG2a, 1:10,000 for SEA-specific IgM, and 1:1,000 for P. chabaudi-specific IgG1, IgG2a, and IgM antibodies. Bars represent mean OD ± SEM for three to five mice, and solid lines represent pooled data from control animals infected with S. mansoni only assayed in parallel at each time point ± SEM (−−−). #, statistically significant differences (P < 0.05) between mice with S. mansoni infection only and mice with concurrent S. mansoni-P. chabaudi infection; ∗, statistically significant differences (P < 0.05) between mice with P. chabaudi infection only and mice with concurrent S. mansoni-P. chabaudi infection.

