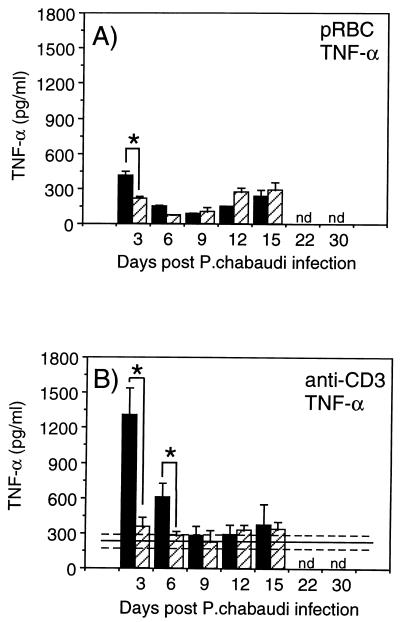
FIG. 6.
TNF-α responses in in vitro-stimulated spleen cell
cultures from mice with P. chabaudi infection only
(■) or from mice with concurrent S. mansoni-P.
chabaudi infection
( ).
Cultures were stimulated with pRBC (A) or anti-CD3 (B). Bars represent
mean levels for three to five mice ± SEM, and solid lines
represent pooled data from S. mansoni-only-infected
control animals assayed in parallel at each time point ± SEM
(−−−). ∗, represents statistically significant differences
(P < 0.05) between mice with P.
chabaudi infection only and mice with concurrent S.
mansoni-P. chabaudi infection. nd, not determined.

