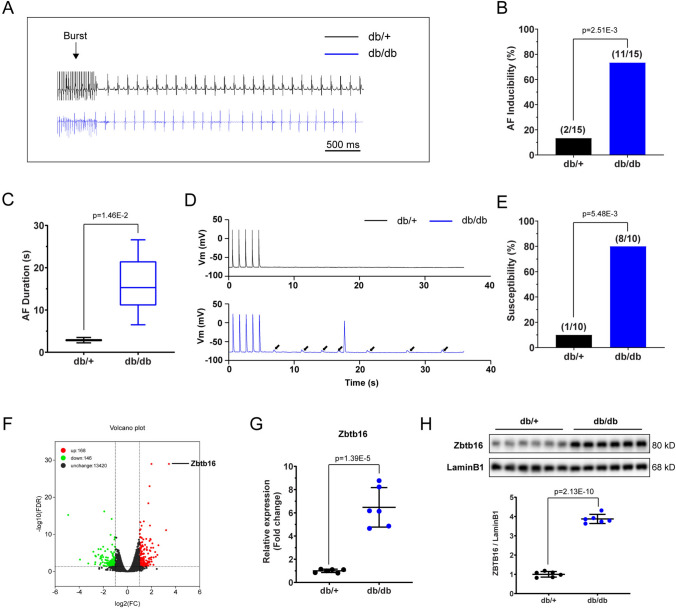
Fig. 1.
The db/db mice showed increased AF vulnerability with elevated Zbtb16 expression in atria. A Representative surface ECGs of db/ + and db/db mice induced by intracardiac electrical stimulation. Bar = 500 ms. B, C AF inducibility (B, n = 15 for each group) and duration (C) analysis. D, E Representative DAD images (D, solid arrow) of db/ + and db/db mouse atrial myocytes recorded by patch-clamp and analysis of susceptibility (E, n = 10 for each group). F The volcano plot of DEGs between db/ + and db/db mouse atria (n = 3 in each group). G RT-PCR analysis of Zbtb16 mRNA in db/ + and db/db mouse atria (n = 6 for each group). H Analysis of Zbtb16 protein expression in db/ + and db/db mouse atria (n = 6 for each group). Data in B, E were analyzed by Fisher’s exact test. Data in C, G and H were analyzed by two-tailed student t test. AF, atrial fibrillation

