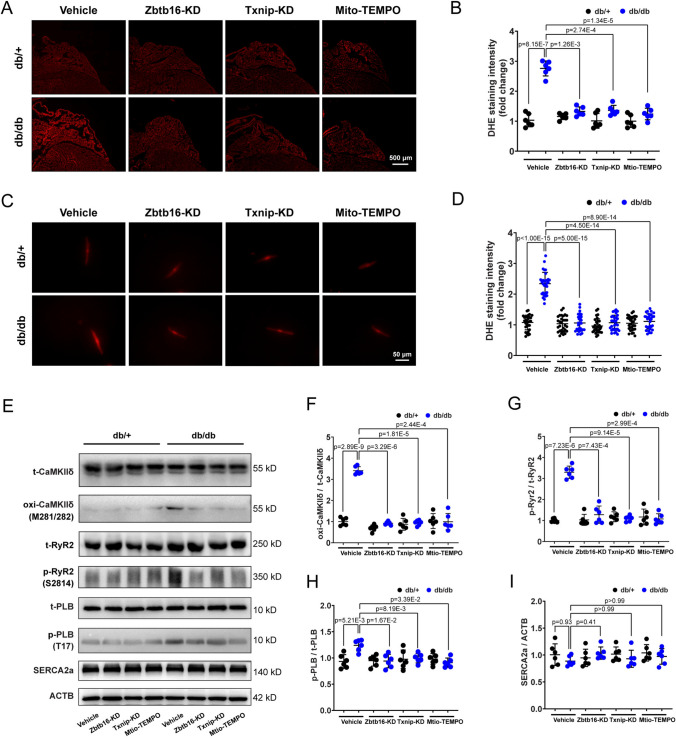
Fig. 4.
Zbtb16 or Txnip knockdown reduced ROS generation and CaMKIIδ activation. A, B Representative images (A) and quantitative analysis (B) of ROS level measured by DHE staining in db/ + and db/db mouse atria with Zbtb16-KD, Txnip-KD or Mito-TEMPO treatment (n = 6 for each group). Bar = 500 μm. C, D Representative images (C) and quantitative analysis (D) of ROS level measured by DHE staining in db/ + and db/db mouse atrial myocytes (n = 30 from 6 mice, 5 cells were calculated in each mouse). Bar = 50 μm. E–I Representative WB images (E) and quantitative analysis in db/ + and db/db mouse atria of CaMKIIδ (F), RyR2 (G), PLB (H) and SERCA2a (I) with Zbtb16-KD, Txnip-KD or Mito-TEMPO treatment (n = 6 for each group). Data in (B, D, and F–I) were analyzed by two-way ANOVA with Bonferroni’s multiple comparisons test. KD knockdown

