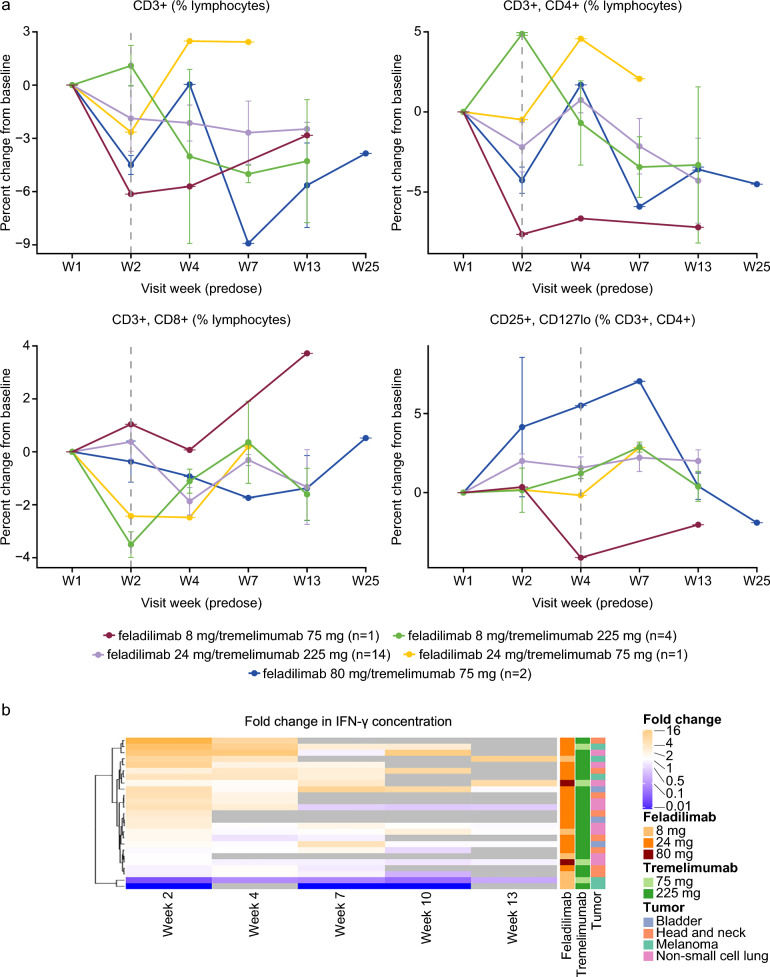
Fig. 2.
Pharmacodynamic analysis of blood-based biomarkers. Blood-based flow cytometry analysis showing percentage of CD3+ , CD4+ , CD8+ , and Tregs, across dose levels (a) and peripheral IFN-γ cytokine induction (b). Grey boxes in panel a represent no available data. No statistical analyses were performed due to small sample sizes per dose level. CD cluster of differentiation, IFN-γ interferon gamma, Tregs regulatory T cells, W week

