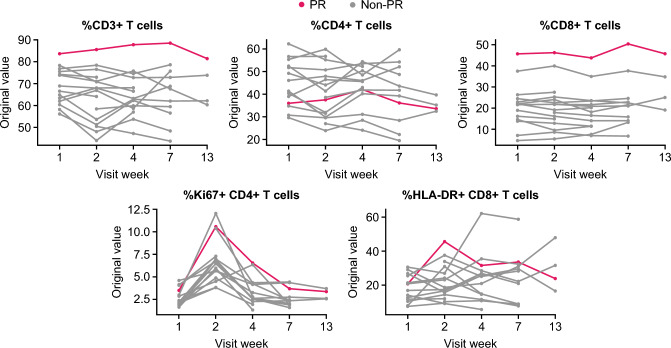
Fig. 4.
Flow cytometry analysis of the PR patient receiving feladilimab 24 mg/tremelimumab 255 mg. Blood-based flow cytometry analysis showing percentage of CD3+ , CD4+ , CD8+ , Ki67/CD4+ and HLA-DR+ /CD8+ T cells across time. Red line indicates T-cell frequencies in the patient achieving a PR relative to other patients (gray lines) enrolled in the same dose-level cohort. CD cluster of differentiation, HLA-DR human leukocyte antigen DR isotype, Ki67 marker of proliferation Ki-67, PR partial response

