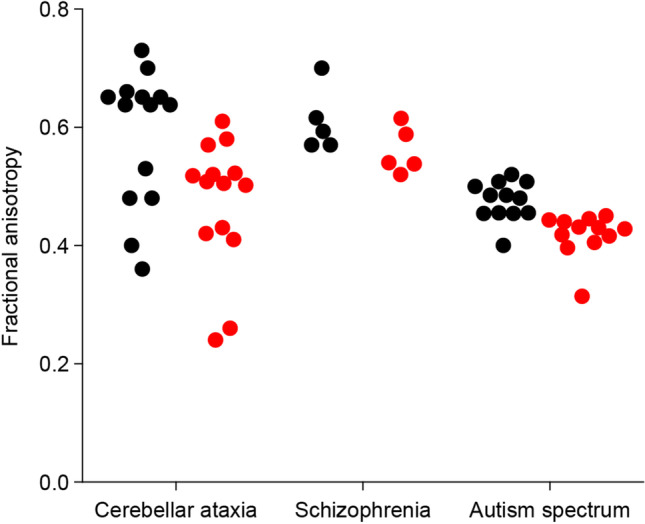
Fig. 5.

Fractional anisotropy values of superior cerebellar peduncle of patients with cerebellar ataxia, schizophrenia, and autism spectrum disorder. Fractional anisotropy values of superior cerebellar peduncle in diseases (red) and corresponding control (black) groups. Graphs showing that fractional anisotropy values of superior cerebellar peduncle in ataxia, schizophrenia, and autism spectrum disorder were significantly different than in the corresponding control groups. For details and references (see Table S3)
