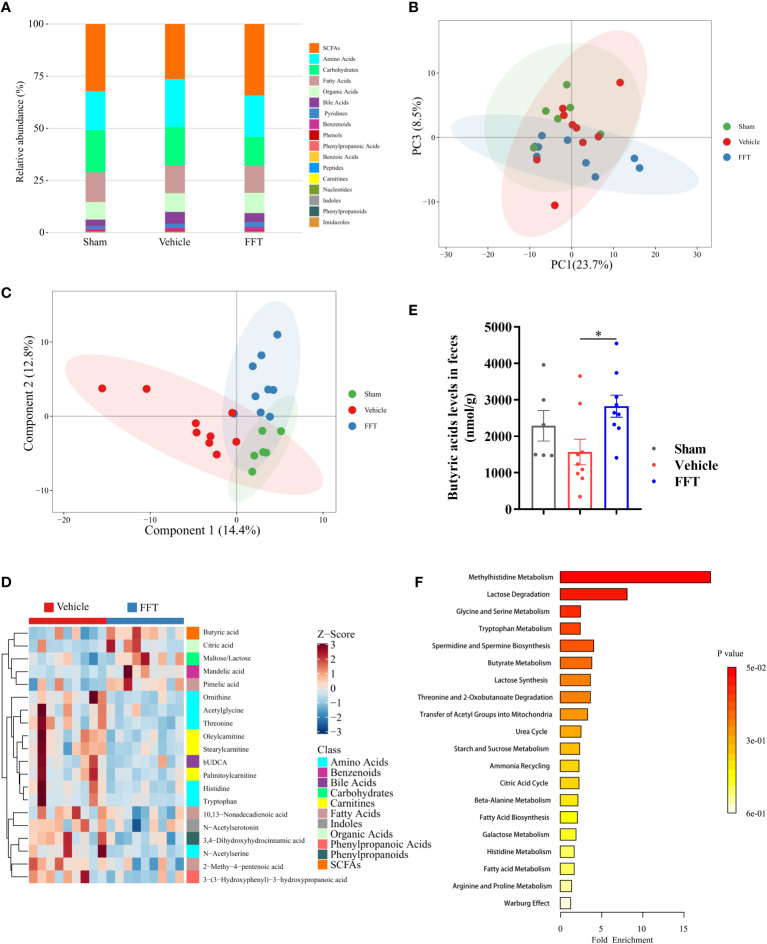
Figure 6.
Fecal metabolome profiling of recipient mice. (A) A bar chart of the metabolite classification overview. (B) PCA plot of feces from sham, vehicle and FFT groups. (C) PLS-DA plot of feces from sham, vehicle and FFT groups. (D) Heatmap of potential biomarkers between the FFT and vehicle groups, with the screening criteria of P < 0.05, |log2FC| >= 0 in univariate analysis and VIP > 1 in multidimensional analysis. (E) Butyric acid levels in the feces of mice treated with FFT or vehicle. (F) metabolite sets enrichment overview. Data are reported as mean ± SEM. Each symbol represents a mouse. *P < 0.05.

