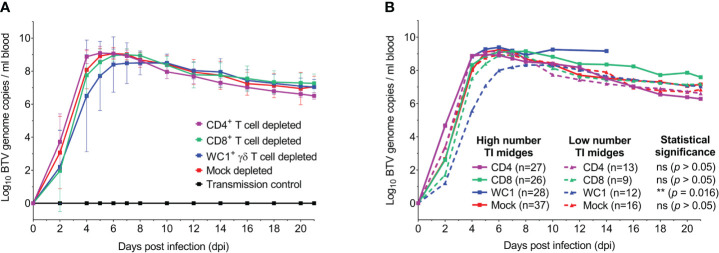
Figure 4.
T cells do not influence bluetongue virus (BTV) infection dynamics in sheep. (A) Mean ( ± SD) log10 BTV genome copies detected per ml blood each in seven mock (red), CD4+ (purple), CD8+ (green), or WC1+ γδ (blue) T cell-depleted sheep during infection with BTV-4 MOR2009/07. BTV RNA was not detected in the blood of any uninfected (negative control) animals (black, n = 5), confirming contact transmission had not occurred. The means of each depletion group were not statistically significant (p > 0.05), as determined by a non-parametric Kruskal–Wallis test and post-hoc Dunn’s multiple comparisons. (B) Comparison of detectable BTV RNA (mean log10 BTV genome copies per ml blood) in mock (red), CD4+ (purple), CD8+ (green), and WC1+ γδ (blue) T cell-depleted sheep with either a high (n ≥ 18, solid lines) or low (n < 18) number of transmissibly infected (TI) midges (Cq < 25) blood-feeding to establish infection at 0 dpi. The average numbers of TI midges fed on sheep of each treatment group within each of the low and high TI midge categories are given in parentheses. WC1+ γδ T cell-depleted sheep had significantly earlier and higher detectable BTV RNA levels in the blood upon feeding by a higher (versus lower) number of TI midges (p = 0.016), suggesting a dose-dependent effect on viraemia linked to the WC1+ γδ T-cell subset. However, no significant differences were observed in mock, CD4+, or CD8+ T-cell depletion groups (p > 0.05). Statistical significance determined by non-parametric Mann–Whitney test.

