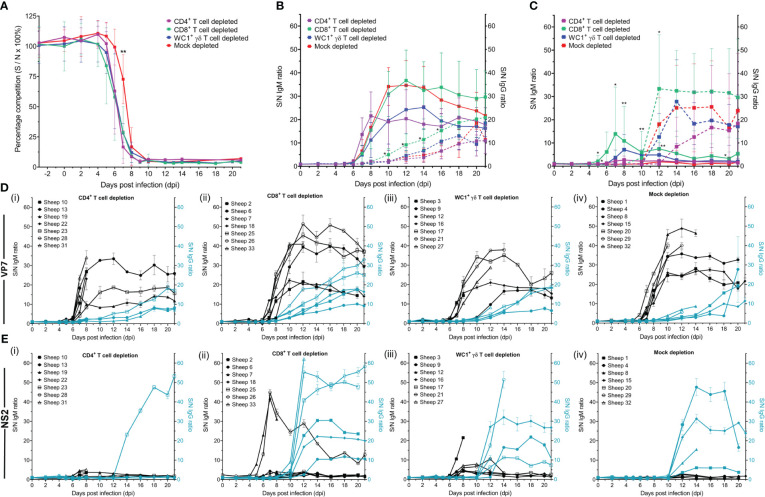
Figure 8.
Host immunoglobulin subclasses against bluetongue virus (BTV) VP7 and NS2 proteins respond differently to T-cell depletion. (A) Percentage competition (S/N% ± SD) of anti-BTV VP7 antibodies in serum of CD4+ (purple, n = 7), CD8+ (green, n = 7), or WC1+ γδ (blue, n = 7) T cell- or mock-depleted (red, n = 7) sheep during infection with BTV-4 MOR2009/07 as determined by the ID Screen® BT cELISA. Competition was calculated as a percentage of the test sample (S) optical density (OD) from the negative (N) control OD, with a 50% reduction in S/N% from that of the average sheep-matched pre-infection (−3 dpi to 0 dpi) serum considered positive for anti-VP7 antibodies. CD4+ T cell-depleted sheep seroconverted significantly earlier than mock-depleted sheep (p = 0.023 [**]), as determined by a non-parametric Kruskal–Wallis test and post-hoc Dunn’s multiple comparisons. (B) IgM (solid lines) and IgG (dotted lines) anti-VP7 or (C) anti-NS2 antibodies detected in CD4+ (purple), CD8+ (green), or WC1+ γδ (blue) T cell- or mock-depleted (red) sheep during infection with BTV-4 MOR2009/07. Absorbance at 450 nm is presented as a ratio of average sample (S) to negative (average pre-infection, −3 dpi to 0 dpi) (N) OD values performed in duplicate, with error bars representing standard deviation (SD). Statistical significance in S/N OD ratio at each time point is given (≥0.0332 [*], ≥0.0021 [**], ≥0.0002), as determined by a non-parametric Kruskal–Wallis test. For those found to be significant, a post-hoc Dunn’s multiple comparisons test was carried out to determine whether T-cell depletion groups significantly differed from the mock-depleted group. (D) S/N OD ratios ( ± SD) for IgM (black) and IgG (blue) anti-VP7 and (E) anti-NS2 antibodies detected in the serum of individual sheep of the (i) CD4+, (ii) CD8+, or (iii) WC1+ γδ T cell- or (iv) mock-depleted groups during BTV infection.

