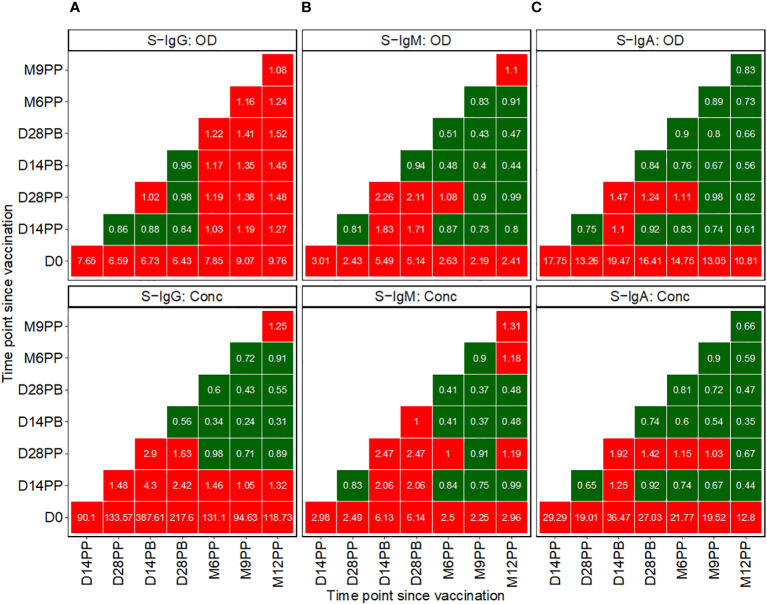
Figure 3.
Pairwise Temporal Dynamics of Median Fold-Changes in Spike-Directed Antibody Responses Across Sequential Time Points. Figure 3 illustrates the median changes in Spike-directed IgG (A), IgM (B), and IgA (C) antibodies over time. The fold change quantifies the ratio of median antibody levels between a reference timepoint (on the y-axis) and a subsequent timepoint (on the x-axis). Red boxes indicate increases, while green boxes indicate decreases. A value of one in a box signifies no change from the baseline reference, values below one indicates decreases, and values above one represents increases.

