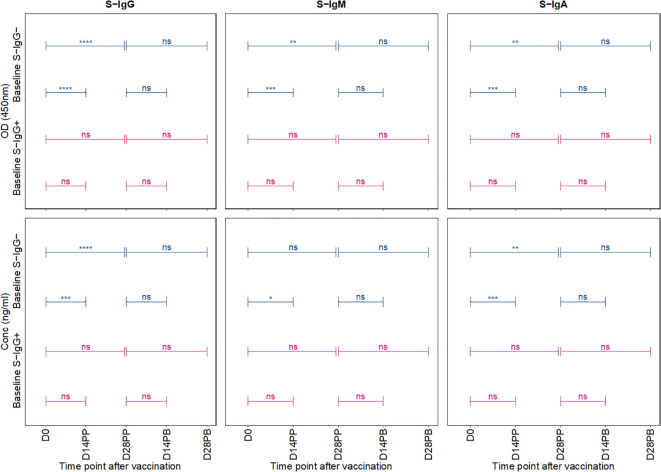
Figure 5.
Comparative Analysis of Antibody Responses Post-Primary and Booster Vaccination Stratified by Baseline Spike-IgG Status. Figure 5 presents a comparative analysis of antibody optical densities (OD) and concentrations (ng/ml) following primary and booster immunizations, segregated by initial Spike-IgG levels, key data for these comparisons is shown in earlier plots. Participants are categorised into Spike-IgG positive (red) and negative (blue) groups. The figure illustrates changes in Spike-specific IgG, IgM, and IgA antibody levels at two and four weeks after each vaccine dose. The significance of the difference in antibody responses after each dose is evaluated using an unpaired Wilcoxon test, with multiple testing adjustments made using the Hochberg method. Significance levels are denoted as not significant ns, p > 0.05; *, p ≤ 0.05; **, p < 0.01; ***, p < 0.001, and ****, p < 0.0001.

