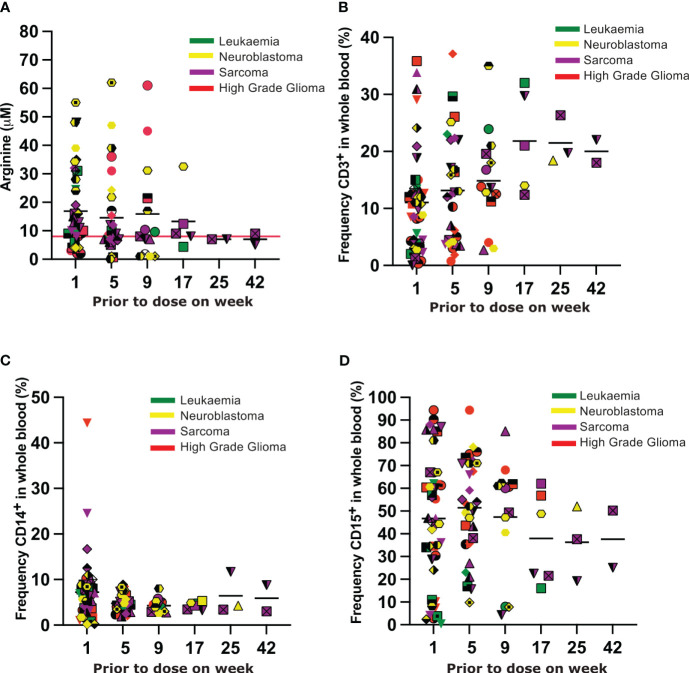
Figure 3.
(A) Plasma arginine concentrations prior to each dose of BCT-100. Each unique symbol represents an individual patient. Each color represents the tumour subtype, as indicated in the legend. (B–D) Frequency of CD3+ T cells, CD14+ myeloid cells and CD15+ myeloid cells respectively in the blood of patients prior to each dose of BCT-100. Each unique symbol represents an individual patient. Each color represents the tumour subtype, as indicated in the legend.

