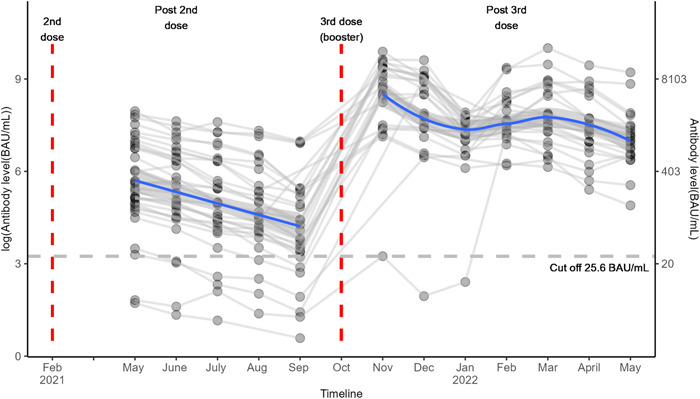
Figure 1.

Trends in antibody level over time after SARS‐COV‐2 BNT162b2 vaccination. Each line represents a single patient trend. The horizontal dashed line is the positive/negative cutoff for antibody level protection (25.6 BAU/mL). The blue solid lines represent smoothed mean antibody level over time in pre‐ and postbooster periods.
