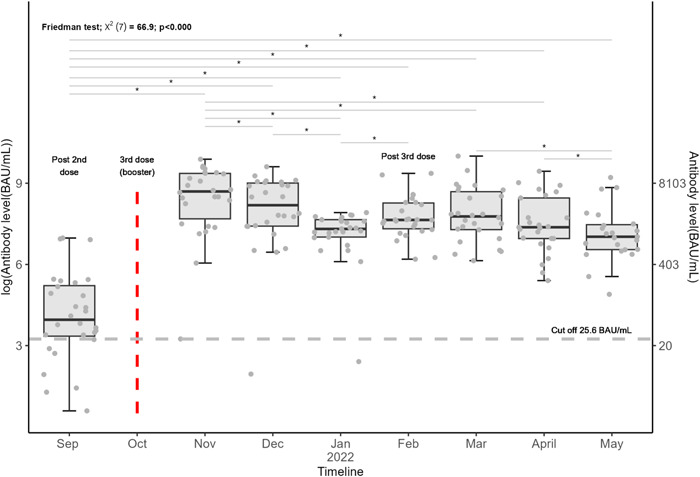
Figure 2.

Boxplots of antibody level over time after a SARS‐COV‐2 BNT162b2 booster. Each dot represents a subject. The center line in each boxplot represents the median, and the lower and upper lines represent the 25th and 75th percentile, respectively. Friedman test was used for overall testing. “*” represents a statistically significant difference in antibody level between two‐time points. p value < 0.05 was considered significant. The horizontal dashed line is the positive/negative cutoff for antibody level protection (25.6 BAU/mL).
