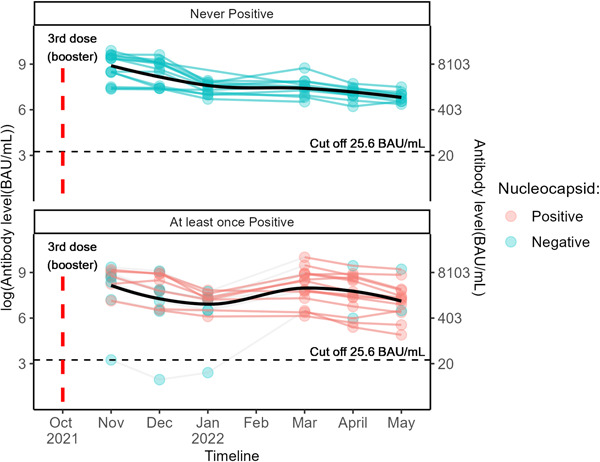
Figure 4.

Antibody level over time after a SARS‐COV‐2 BNT162b2 booster, stratified by infection status over time. Each line represents a single patient trend. Color of each dot represents nucleocapsid status for that month. Subjects in the top never had an infection during the study period as determined by nucleocapsid result, while those in the bottom had at least one positive nucleocapsid result. The horizontal dashed lines are the positive/negative cutoff for antibody level protection (25.6 BAU/mL). The black solid lines represent smoothed mean antibody level over time.
