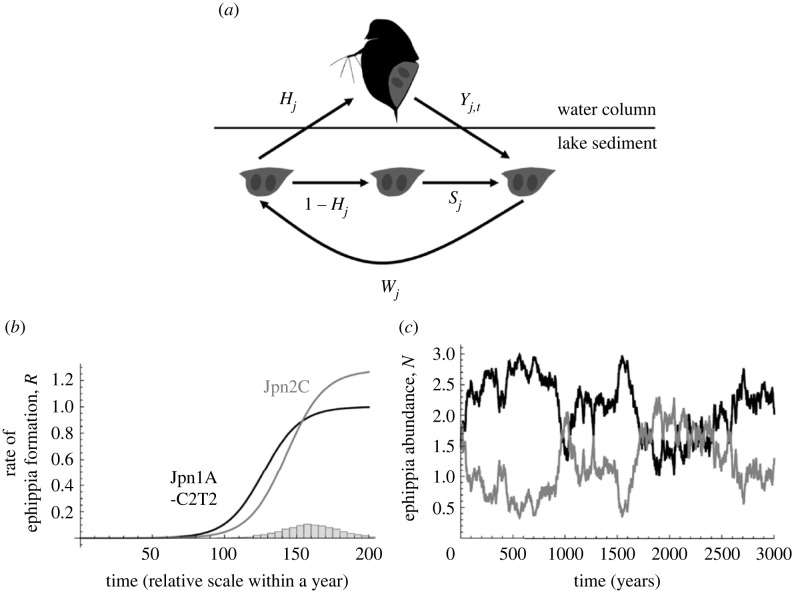
Figure 1.
Assumptions of the theoretical analysis (a,b) and an exemplifying simulation run of stable coexistence of the two genotypes via the temporal storage effect (c). (a) The dynamics of diapausing eggs in equation (2.1). (b) Lines represent cumulative curves of produced diapausing eggs (the black line is Jpn1A-C2T2 and the grey line is Jpn2C). Note that the values on the horizontal axis represent the relative timing of diapause induction, and thus the absolute values themselves are not significant. Parameter values are a1 = 1, a2 = 1.28, b1 = 0.0783, b2 = 0.0764, c1 = 127 and c2 = 143. The histogram in (b) indicates the inter-annual fluctuation in the length of growth season et (in this panel, µ = 160 and σ = 20). Based on the laboratory experiments, we assumed that Jpn1A-C2T2 starts producing diapausing eggs earlier than Jpn2C, and Jpn2C produces more diapausing eggs than Jpn1A-C2T2 when the growth period is long (electronic supplementary material, appendix S1). If the length of the growing season fluctuated among the years as shown by the histogram in (b), the two genotypes can stably coexist (c). Other parameter values are w1 = w2 = 0.9, H1 = H2 = 0.1, s1 = s2 = 0.9 and K = 1.

