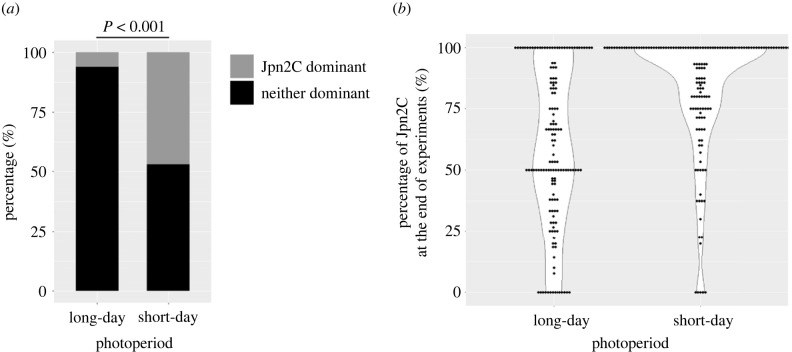
Figure 2.
Percentages of matches where Jpn2C dominated (grey) and neither dominated (black) on day 30 under the long-day condition (14 : 10 h light : dark) and short-day condition (10 : 14 h light : dark). (a) No match was dominated by Jpn1A-C2T2. Results were detected using the t-test. Whether the results were different between long-day and short-day was tested by two-sided tests of equality of proportions. (b) The violin plot representing percentages of Jpn2C on the last day of the experiment. Points represent the percentages of Jpn2C in each match. White areas represent the data distributions. The plot was made using ggplot2 package of R [56].

