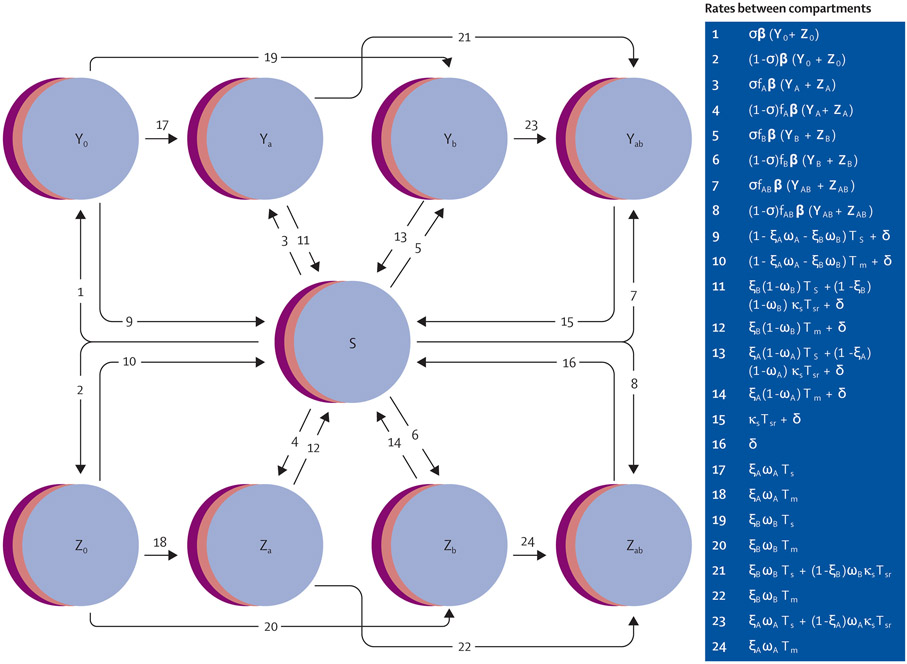
Figure 1: Schematic of gonorrhoea transmission model.
Infections are further stratified by resistance profile, where 0=susceptible, a=resistant to drug A, b=resistant to drug B, and ab=resistant to both drugs. Overlapping discs for all compartments represent the model’s stratification into three sexual activity groups: low, intermediate, and high. Arrows depict rates between compartments and would be multiplied by the compartment from which they flow to generate the model’s set of differential equations (appendix, pp 8-9). Individuals can also enter and exit the population at rate ρ (arrows not shown). Rates shown here apply to random 50–50 allocation, reserve, and gradual switch strategies; rates for combination treatment vary slightly and are shown in the appendix (p 9). A transition from a drug-susceptible infection (Y0, Z0) to a dual resistant infection (YAB, ZAB) is only possible under combination therapy (arrows not shown). Definitions of all parameters used in rate equations are in table 1. S=susceptible. Y=symptomatic infection. Z=asymptomatic Infection.

