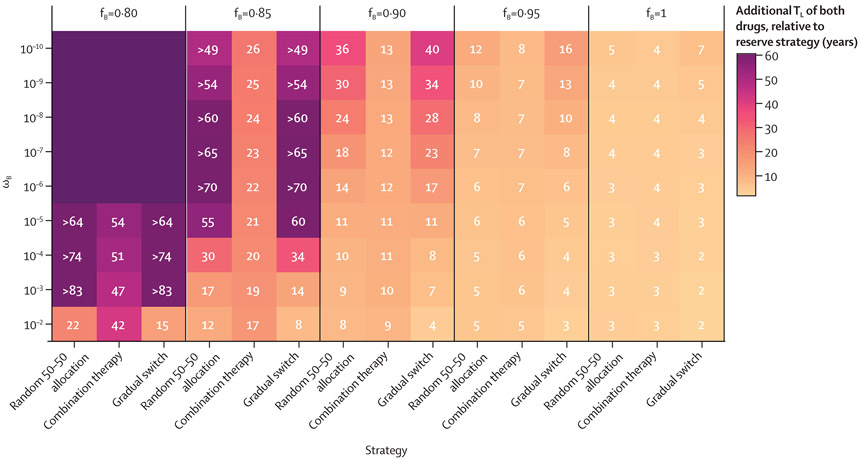
Figure 2: Additional TL (in years) of each of drugs A (ceftriaxone-like) and B (new antibiotic) by strategy relative to that of the reserve strategy (TL strategy–TL reserve), based on properties of a new antibiotic B.
Strategies (x-axis) were compared over a range of plausible parameter values for ωB (y-axis) and fB (vertical facets). These properties were held constant for drug A: ωA=0·98 and fA=10−8. The model run time was extended to 100 years because some parameter sets increased the lifespan of available antibiotics to more than 40 years for all strategies. If the lifespan of the drugs extended beyond 100 years, that strategy’s results are shown either in relative terms for comparison or with an unlabelled dark purple tile, if no strategies on the x-axis had a defined TL under that parameter set for drug B. fB=fitness of drug B resistant strains relative to susceptible bacteria. TL=time in years until both drugs A and B hit their 5% resistance thresholds, warranting new treatment recommendations. ωB=probability of emergence of resistance upon treatment with drug B.

