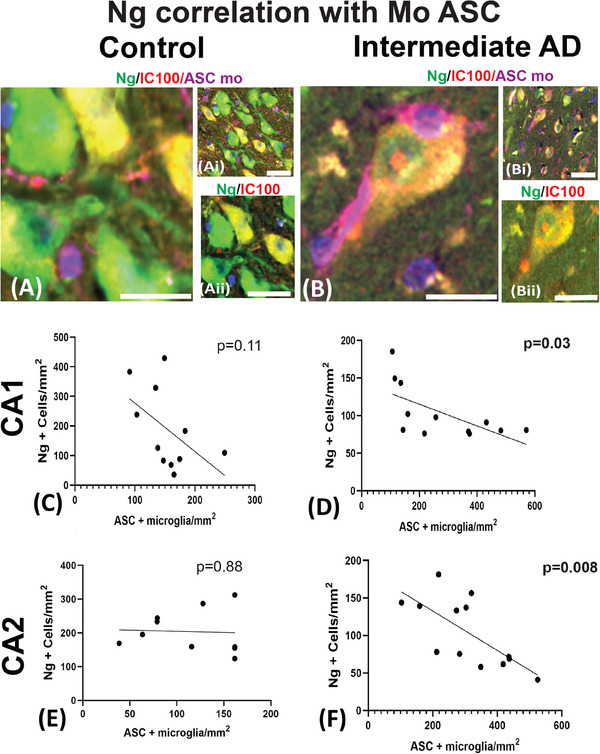
FIGURE 5.

Pearson's correlation analysis of Ng and mouse anti‐ASC proteins seen in the hippocampal subfields. A photomicrograph of Ng (green), 1C100 (red), and mouse anti‐ASC (purple) are seen in control (A, Ai, and Aii) and the intermediate AD cases (B, Bi, and Bii). In the controls, the correlation analysis did not reveal any significant relationship between the number of Ng‐positive neurons and the number of ASC‐positive microglia in CA1 and CA2 (C and E). The intermediate AD cases showed a significant negative correlation between Ng counts and ASC positive microglia in the CA1 (C) and in the CA2 (F) hippocampal regions. AD, Alzheimer's disease; ASC, apoptosis‐associated speck‐like protein containing a caspase recruitment domain; CA, cornu ammonis; Mo, mouse; Ng, neurogranin (Ng). Scale bars = 20 μm (A), (Ai), (Aii), and (B), (Bi), (Bii)
