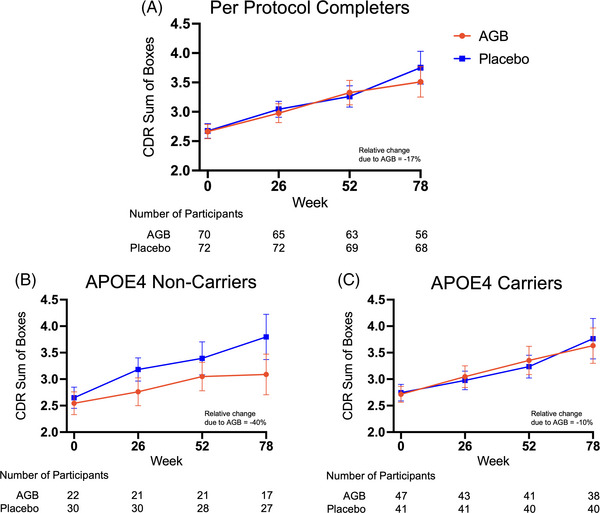
FIGURE 3.

Primary endpoint for per protocol completers. Graphs show the progression of Clinical Dementia Rating‐Sum of Boxes (CDR‐SB) scores over the 78‐week treatment period for both the placebo and AGB101 groups for the per‐protocol completers (A), and for ApoE‐4 noncarrier completers (B), and apolipoprotein E (ApoE‐4) carrier completers (C). Number of participants in each group contributing to each timepoint are provided below each graph. Values represent sample means ± SEM
