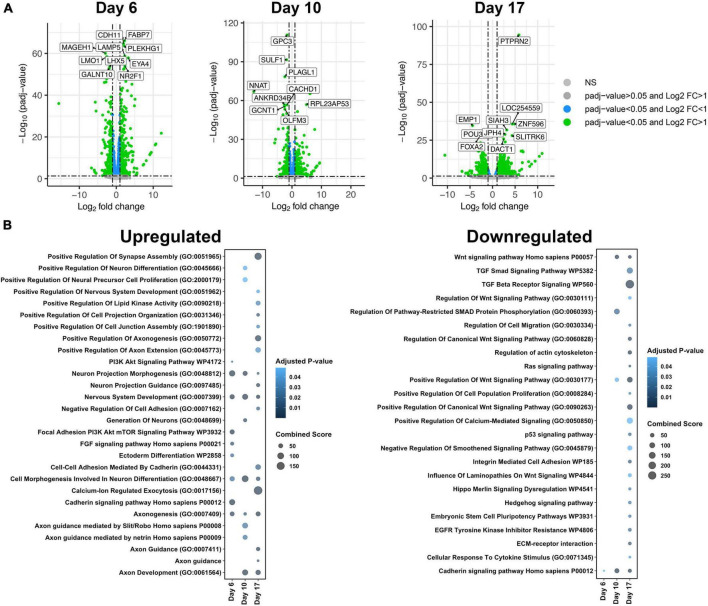
FIGURE 2.
Gene ontology (GO) analysis of differentially expressed genes (DEGs) between isogenic trisomy 21 and euploid cells at each time point. (A) Volcano plots showing DEGs with padj < 0.05 and L2FC > 1 in green, padj < 0.05 in blue, and padj > 0.05 in gray. The top 10 DEGs based on padj are labeled at each timepoint. (B) Bubble plot highlighting unique GO Terms of upregulated genes and downregulated genes per timepoint (day 6, day 10, or day 17).

