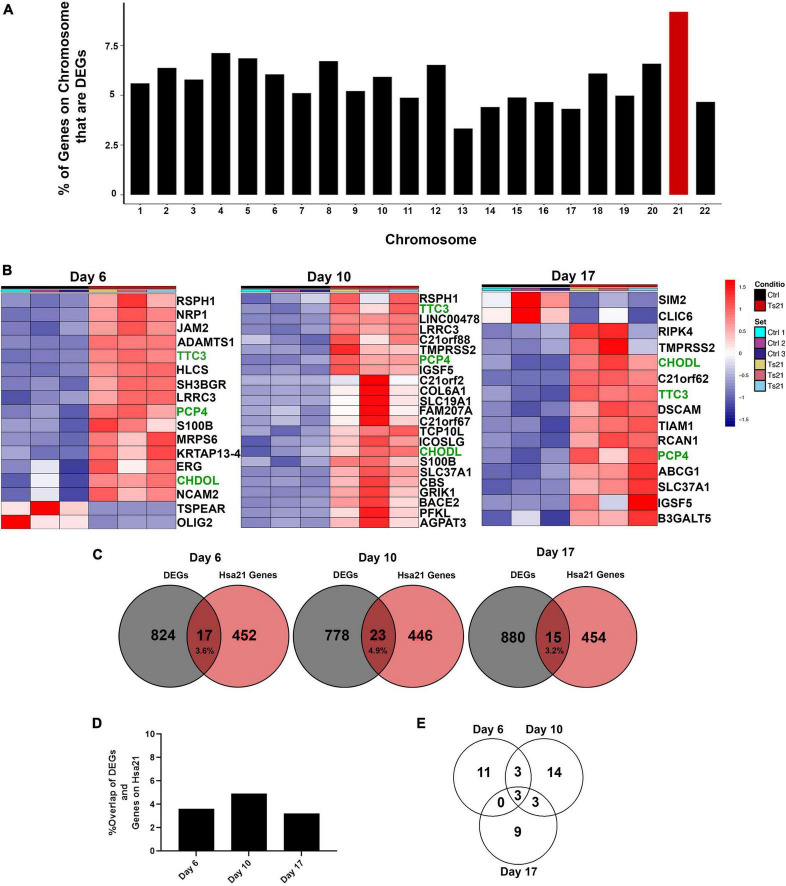
FIGURE 3.
Differential gene expression of HSA21 encoded genes. (A) Graph representing the percent of genes per chromosome that are significant DEGs. (B) Heatmap of differentially expressed chromosome 21 genes using DEGs with a padj < 0.05 and L2FC > 1. Time course replicates are labeled with light gray for day 6, medium gray day 10, and dark gray day 17. Isogenic control is represented by black and T21 by red. Upregulated genes are displayed in red while downregulated genes are expressed in blue, genes that are present at all timepoints are highlighted in green text. (C) Venn diagram showing the number of HSA21 genes overlapping throughout the timepoints. Number of unique Hsa21 genes in red and number of non-overlapping DEGs in gray, overlapping area shows percentage overlap. (D) Graph showing percent overlap at each timepoint. (E) Venn diagram showing the number of Hsa21 genes overlapping with DEGs that have a padj < 0.05 and L2FC > 1.

