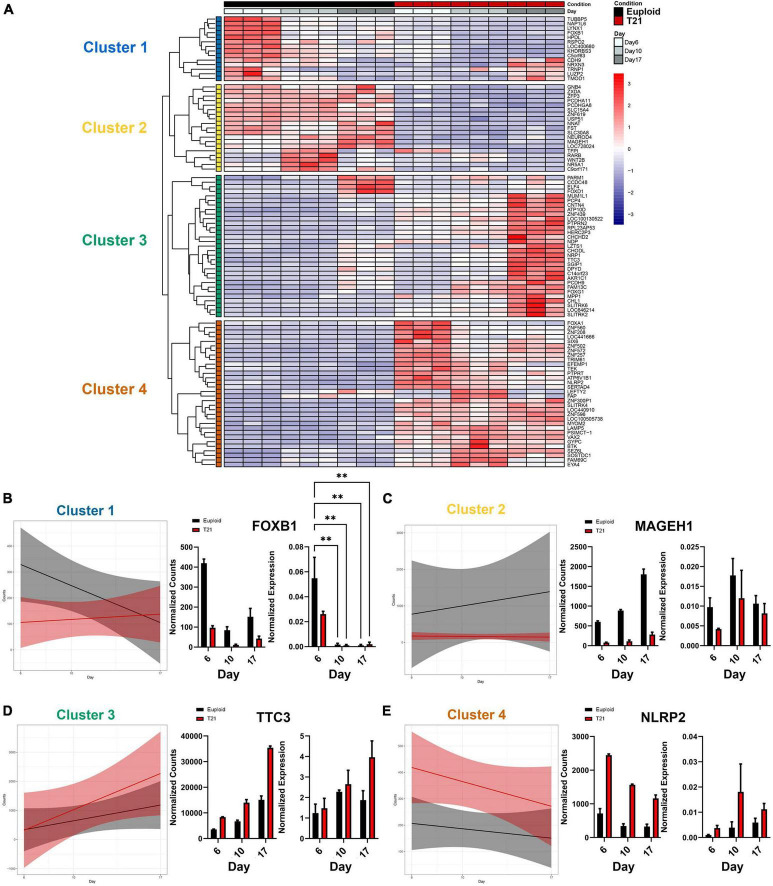
FIGURE 4.
Transcriptional changes in T21 reveal four major expression patterns. (A) Heatmap of differentially expressed genes using DEGs with a padj < 0.05 and L2FC > 1. Hierarchical clustering reveals four clusters. Time course replicates are labeled with light gray for day 6, medium gray day 10, and dark gray day 17. Isogenic control is represented by black and T21 by red. Upregulated genes are displayed in red while downregulated genes are expressed in blue. (B–E) Plots showing linear model of the average expression trends of DEGs in each cluster over the time course of differentiation to neuroectoderm. Graphs show gene expression validation for representative genes over the time course for each cluster with normalized bulk RNAseq counts on the left and normalized expression of quantitative PCR (N = 3 batches, n = 3 technical replicates). Error bars indicate ddCt values ± 1 SD. Statistical difference was determined by two-way ANOVA on ddCt values. **p < 0.01.

