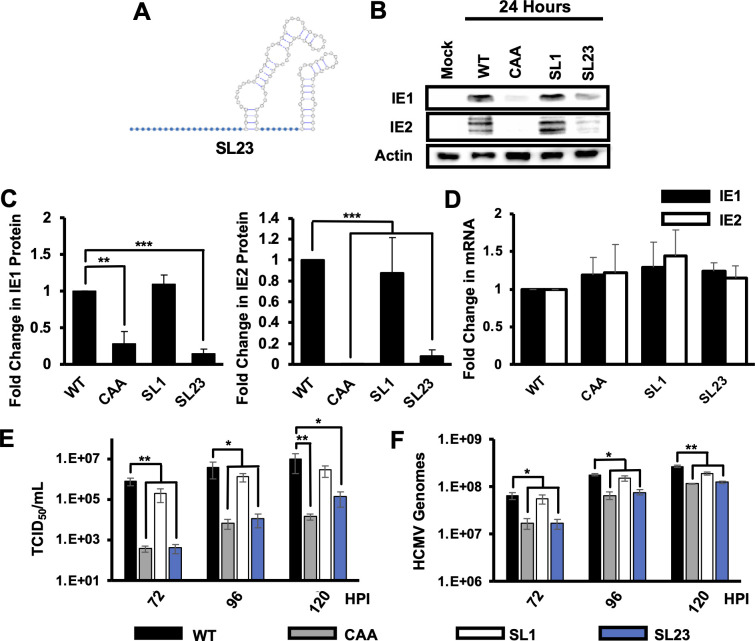
Fig 5.
Stem loop 1 is necessary for efficient IE1 and IE2 expression. (A) Cartoon of SL23 MIE 5’ UTR. (B) Protein levels for IE1 and IE2 were measured by Western blot at 24 hours after infection. Representative results are shown. (C) Quantification of relative IE1 (left) or IE2 (right) protein expression from three independent experiments. Protein levels in WT infected cells are set to 1. (D) Fold change in the abundance of transcripts encoding either IE1 (black) and IE2 (white) at 24 hours after infection as determined by RT-qPCR values in cells infected with WT virus were set to 1. Cell-free infectious virus (E) or HCMV genomes (F) were measured by the TCID50 method or qPCR, respectively, at the indicated times after infection. The graphs show the average and SEM for three independent experiments. All experiments were confirmed with two independent clones of each recombinant virus. Statistical significance was determined by pairwise comparison to values from cells infected with WT virus (*P < 0.05, **P < 0.01, multiple comparison statistics calculated using Dunnett’s test).

