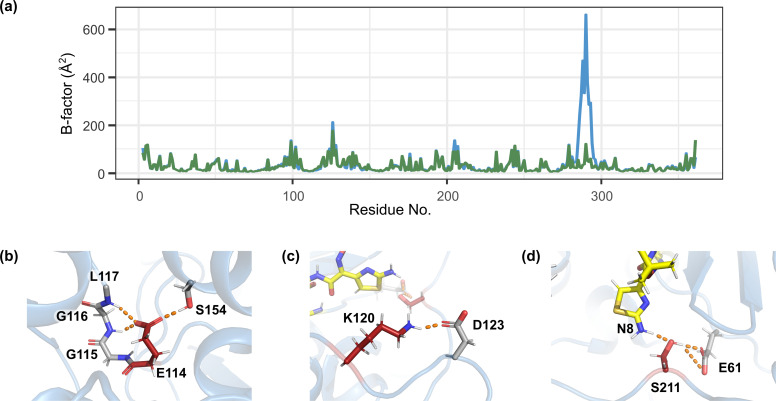
Fig 4.
Molecular dynamics simulation for the CMY-2 and CMY-185 complexes with ceftazidime. (a) B factors profiles of the CMY-2 (green) and the CMY-185 (blue) complexes with ceftazidime. (b–d) Close-up view of the hydrogen bond or salt bridge formation of E114 (b), K120 (c), and S211 (d). The hydrogen bonds or salt bridge were shown as orange dashed lines.

