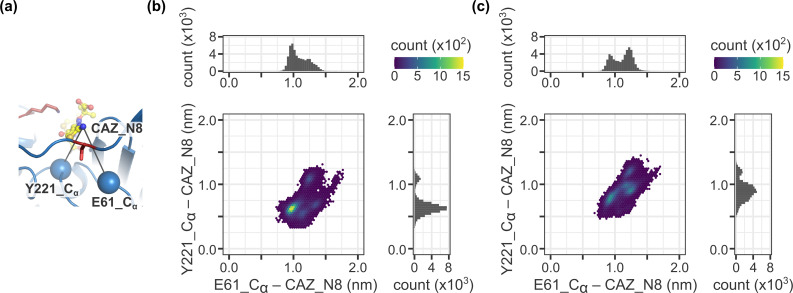
Fig 5.
Fluctuations of the ceftazidime molecule bound to CMY-2 and CMY-185. (a) The Cα atoms for E61 and Y221 are shown as blue spheres. (b, c) 2D histogram for the distance distribution between the N8 atom of ceftazidime (CAZ_N8) and the Cα atoms of E61 (E61_Cα) or Y221 (Y221_Cα). Each point represents a snapshot from the molecular dynamics simulations, colored according to its counts shown in the color bar on the top right corner. (b) CMY-2. (c) CMY-185.

